This topic contains a solution. Click here to go to the answer
|
|
|

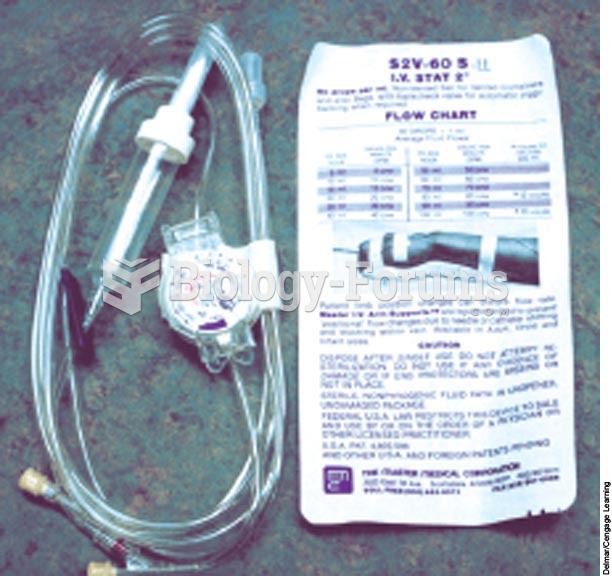 Dial-A-Flo in-line device to regulate IV flow.
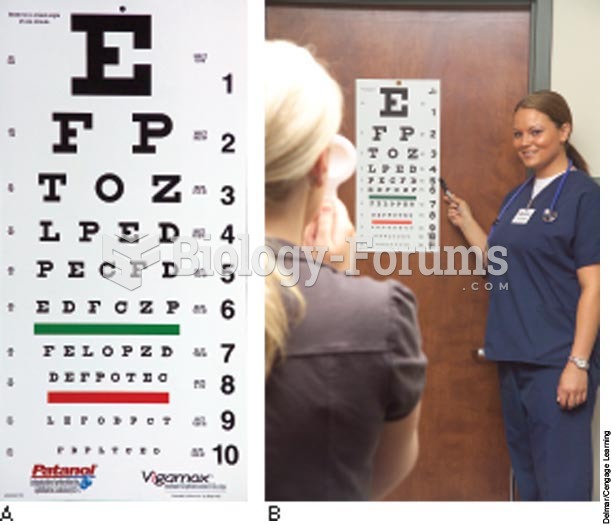 Snellen chart
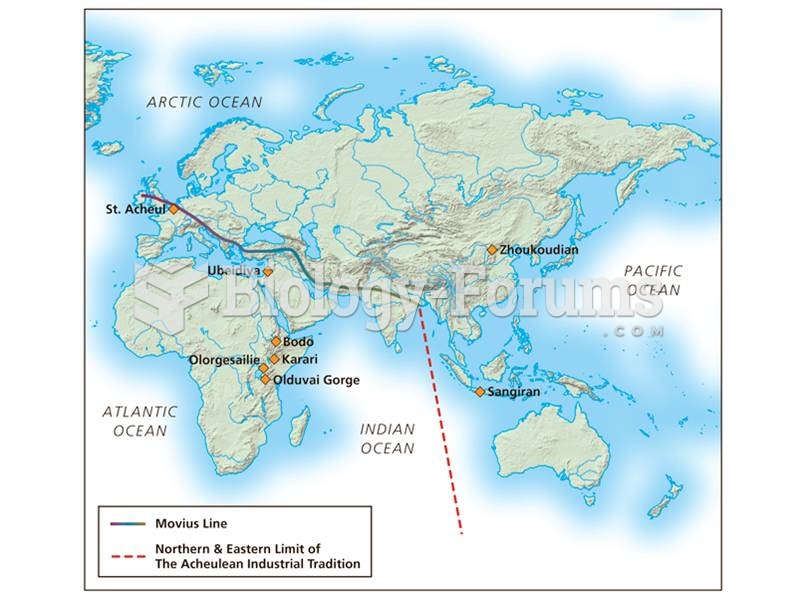 The Movius line separates regions of the world where Acheulean hand axes were made from regions wher
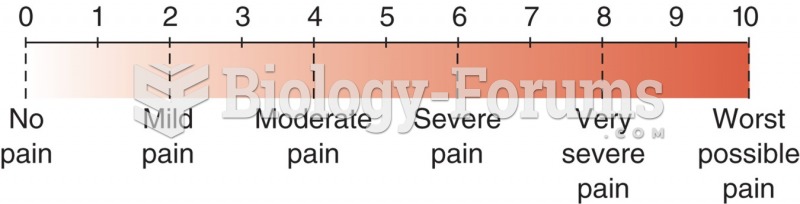 Numerical pain level chart with word modifiers.
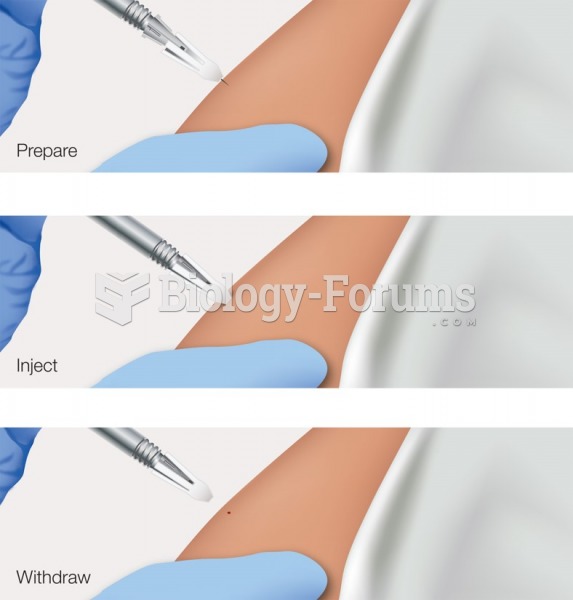 One type of safety needle withdraws into a protective sheath when the injection is complete.
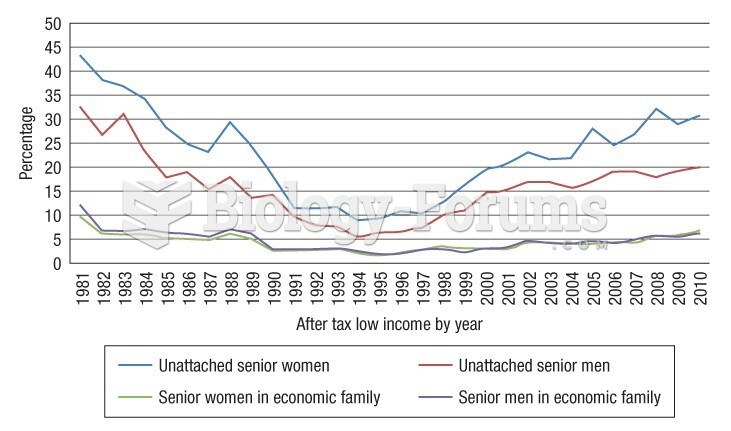 This graph illustrates how unattached older adults are poorer than their peers who live in families