This topic contains a solution. Click here to go to the answer
|
|
|

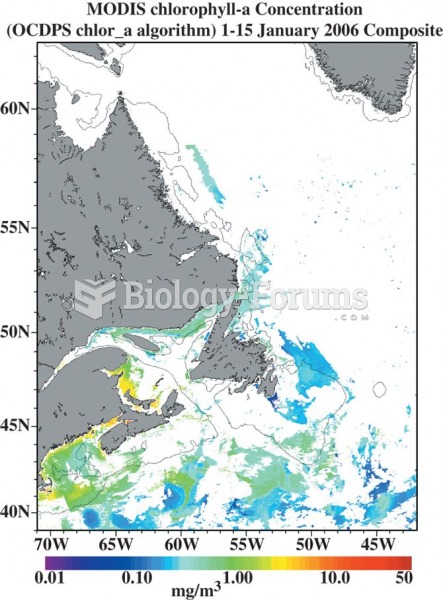 Measures of ocean chlorophyll-a concentrations from part of Atlantic Canada in (a) January 2006, and
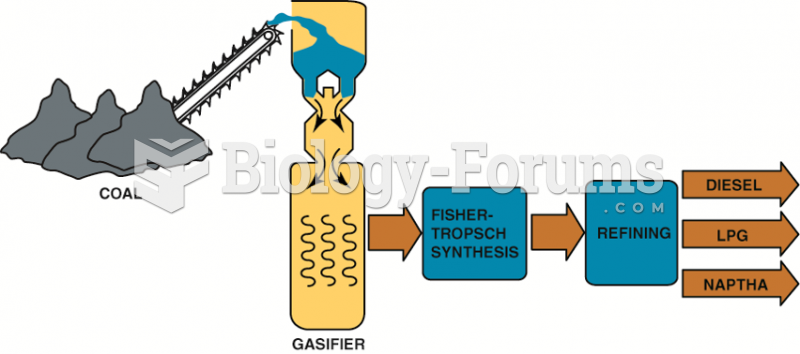 A Fischer-Tropsch processing plant is able to produce a variety of fuels from coal.
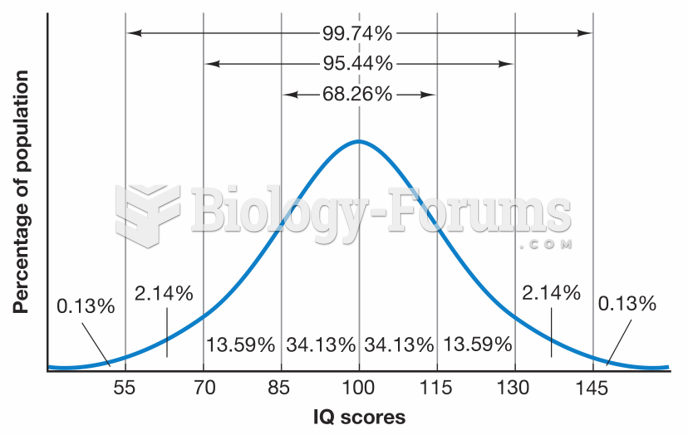 Expected Distribution of IQ Scores
 How many grams of NO are required to produce 145 g of N2 in the following reaction? 4NH3 + 6NO ...
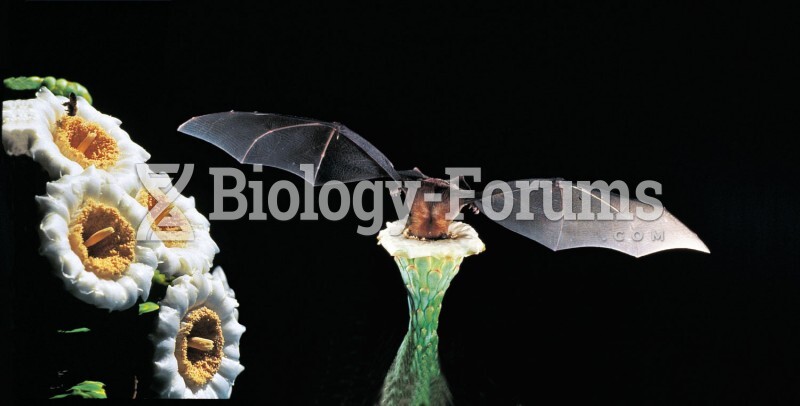 The large, white flowers of giant saguaro cactus (Carnegiea gigantea) produce sweet nectar. The flow
 High in the Andes, a scientist measures the stride of a carnivorous dinosaur