This topic contains a solution. Click here to go to the answer
|
|
|

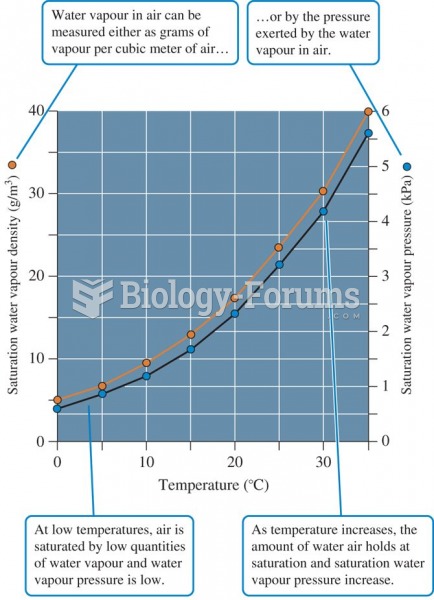 The relationship between air temperature and two measures of water vapour saturation of air.
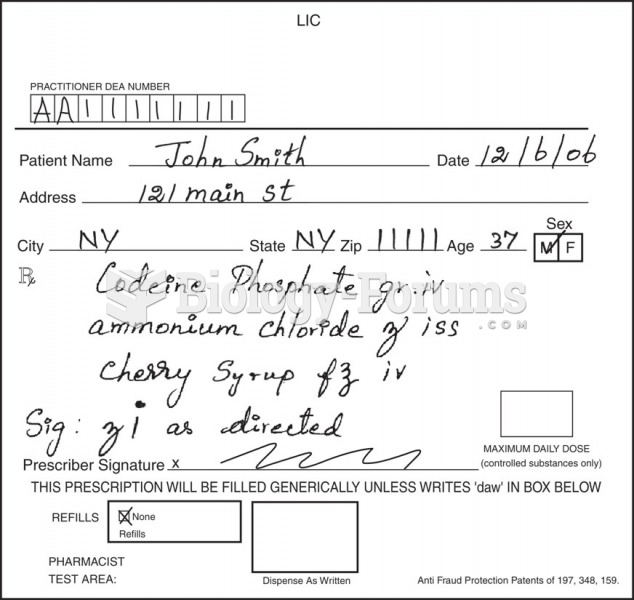 Apothecary measures of weights were often used for prescription writing, especially for compounding. ...
 Samples from the range of continuous variation in human eye color. Different alleles of more than on
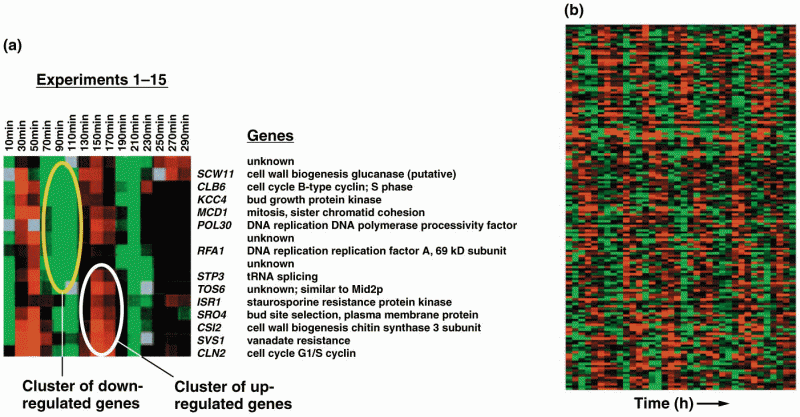 Hierarchical clusters in a microarray experiment using RNA samples from Saccharomyces cerevisiae
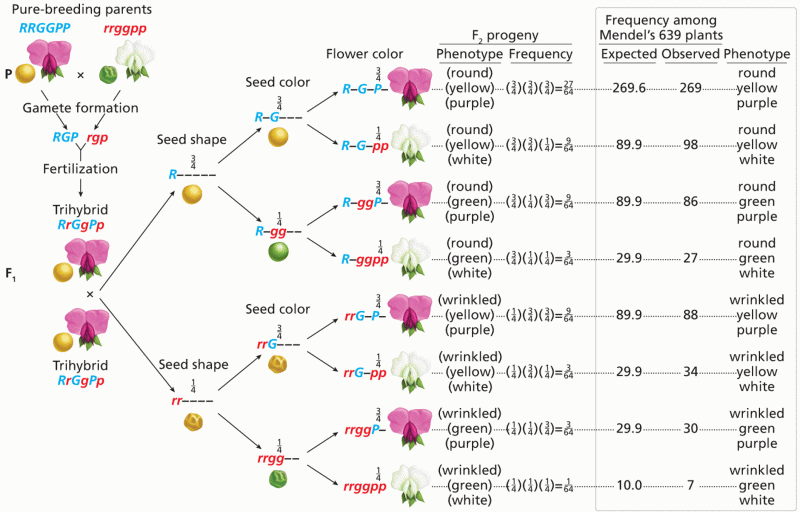 Trihybrid cross to verify independent assortment
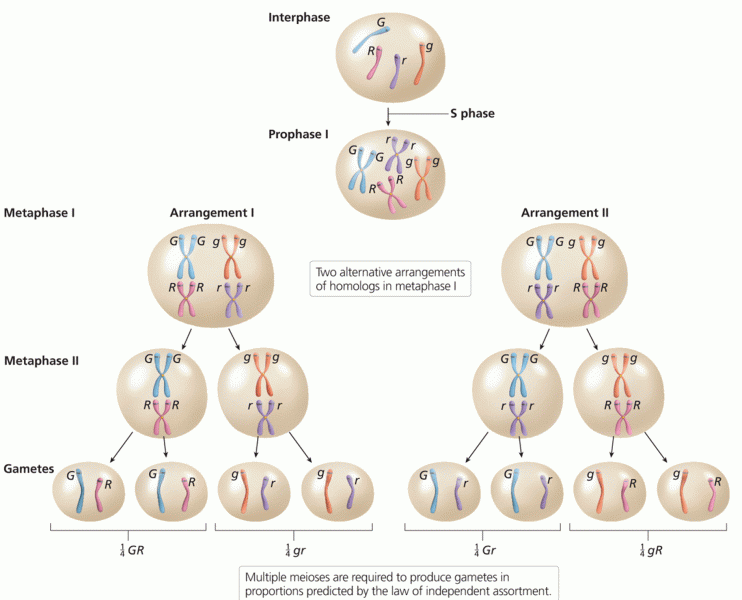 Meiosis and the law of independent assortment