|
|
|

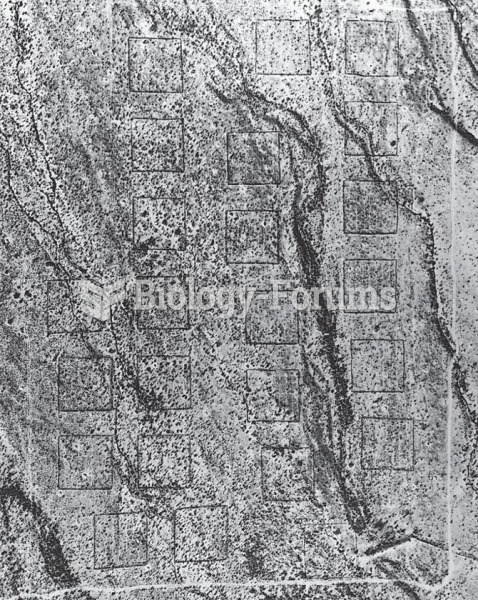 Aerial photo showing the placement of 24 study plots, each 50 m by 50 m, in the Chihuahuan Desert ne
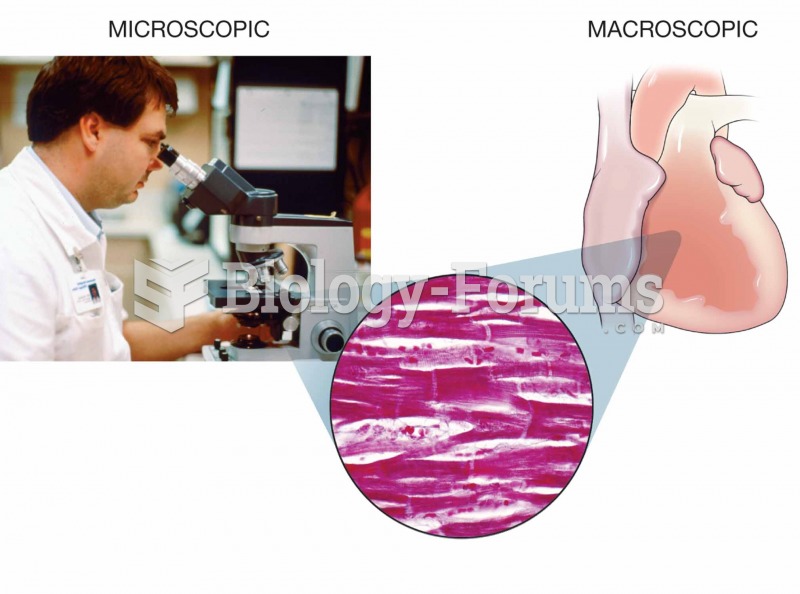 Using a microscope to study the human body
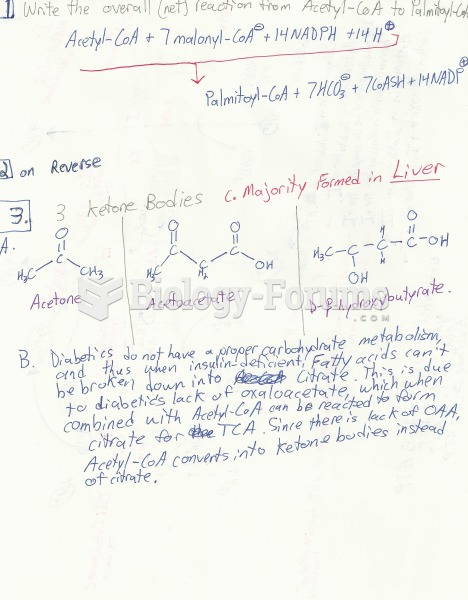 Biochem study guides
 Introduction to Behavioral Research Methods, 6/E
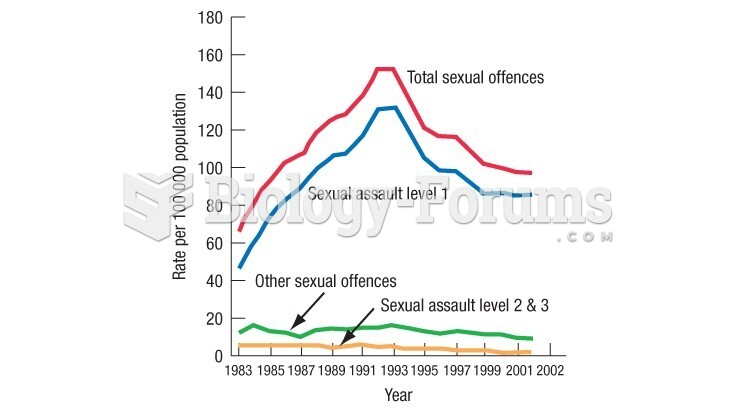 The rates of police reported sexual offences
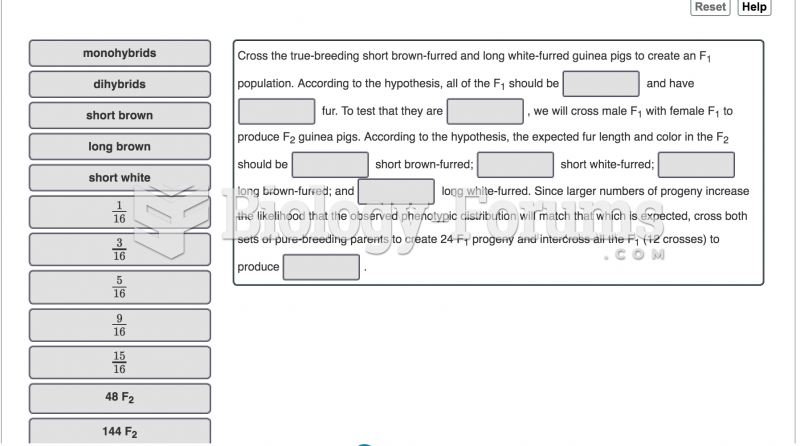 You have four guinea pigs for a genetic study. One male and one female are from a strain that ...