When two normal z-distributions are plotted on the same graph, what can we say about the relative frequency of each z-score?
a. It will always be the same.
b. It will always be different.
c. It depends on the raw score mean.
d. It depends on the raw score standard deviation.
Question 2
To evaluate a person for possible brain damage, a neuropsychologist gives the person a visual memory test and a reading test. To compare the person's performance across these two tests, what should the neuropsychologist do?
a. Graph the raw score distribution for each test on the same graph.
b. Calculate a z-score for each test.
c. Calculate z-scores for the sample means.
d. Find the simple frequency of the person's raw score for each test.

 A normal chest X-ray.
 The anatomical distortion of the structure of RBCs in sickle cell anemia affects its normal function ...
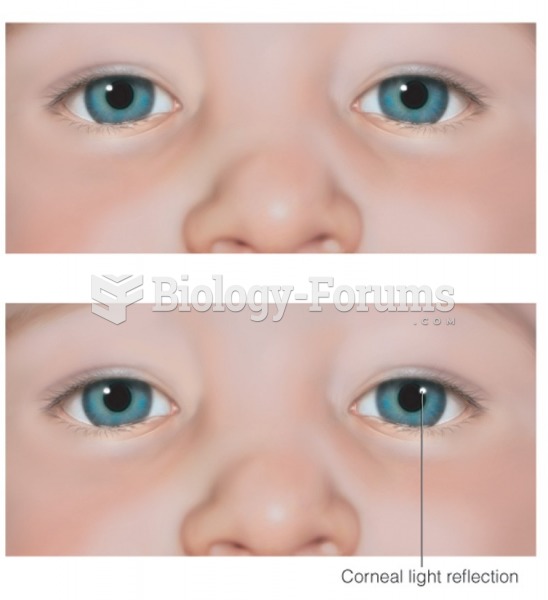 Normal and abnormal corneal light reflection test
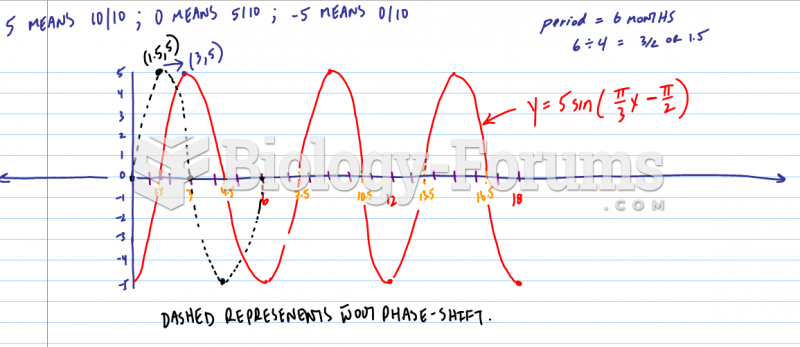 Sketch a graph of the function h(x), by hand on the following interval:
 Picture graph
 A comparison of normal versus petite colonies in the yeast Saccharomyces cerevisiae