When two normal z-distributions are plotted on the same graph, what can we say about the relative frequency of each z-score?
a. It will always be the same.
b. It will always be different.
c. It depends on the raw score mean.
d. It depends on the raw score standard deviation.
Question 2
To evaluate a person for possible brain damage, a neuropsychologist gives the person a visual memory test and a reading test. To compare the person's performance across these two tests, what should the neuropsychologist do?
a. Graph the raw score distribution for each test on the same graph.
b. Calculate a z-score for each test.
c. Calculate z-scores for the sample means.
d. Find the simple frequency of the person's raw score for each test.

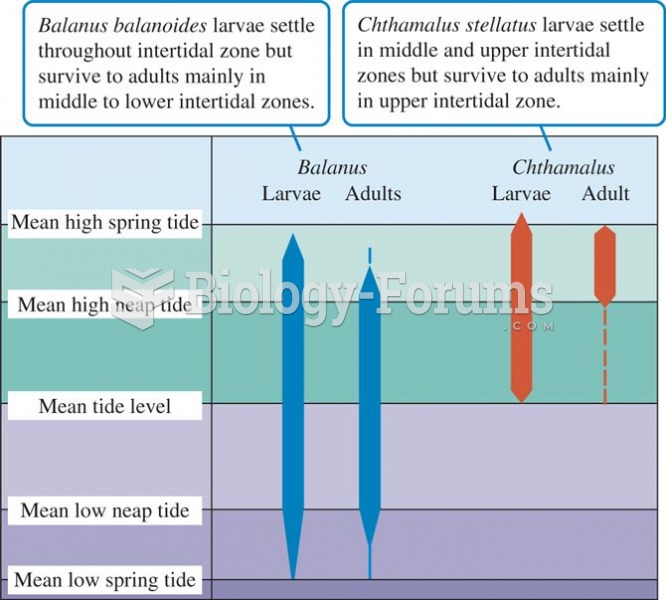 Distributions of two barnacle species within the intertidal zone
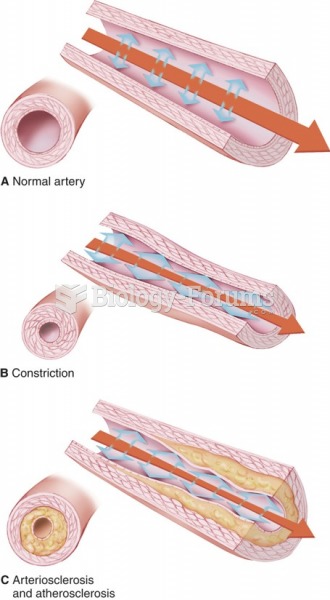 Blood vessels: (A) normal artery; (B) constriction; (C) arteriosclerosis and atherosclerosis.
 How to graph line equations without a table of values
 The normal food link between sea urchins and algae/ Corals
 Finding the graph of a Parabola using certain values
 Normal compound eye of adult Drosophila