When deciding which type of graph (bar, line, histogram, etc.) is appropriate, we consider the characteristics of the
a. variability of the distribution. c. independent variable.
b. mean. d. dependent variable.
Question 2
In a graph of the relationship between the level of noise in an environment and the number of errors a person makes, the _____ is on the X axis and the _____ is on the Y axis.
a. mean number of errors; frequency of errors c. level of noise; frequency of noise
b. level of noise; mean number of errors d. mean number of errors; level of noise

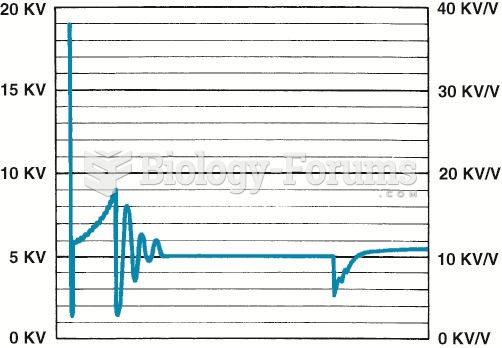 An upward-sloping spark line usually indicates a mechanical engine problem or a lean air–fuel ...
 Positive velocity graph
 How to create a table of values from an equation and graph
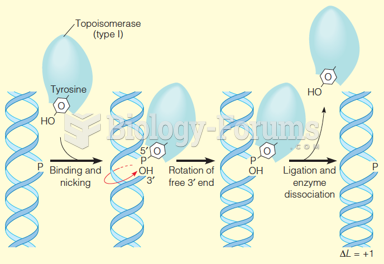 Action of a type I topoisomerase
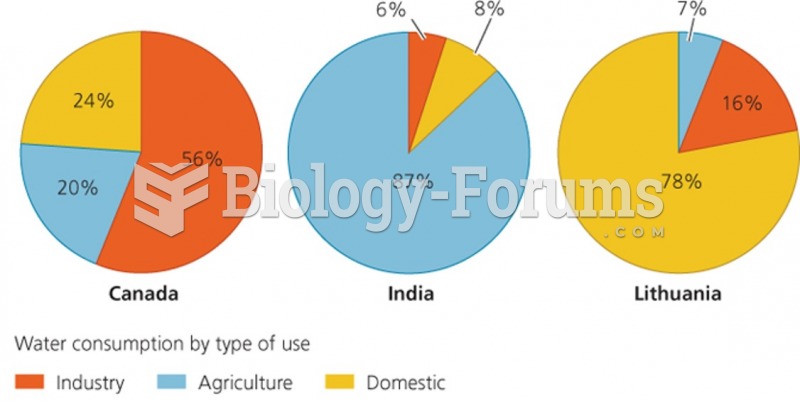 Water consumption by type of use
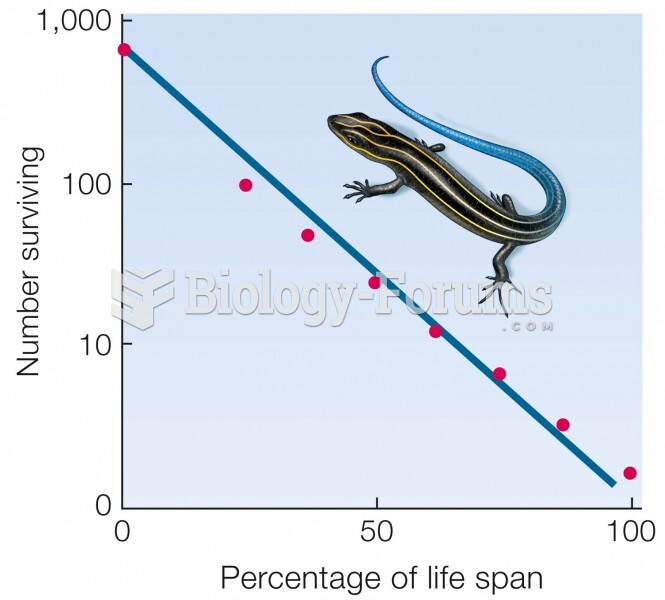 Type II curve. Mortality does not vary with age. Data for five-lined skink (Eumeces fasciatus).