When deciding which type of graph (bar, line, histogram, etc.) is appropriate, we consider the characteristics of the
a. variability of the distribution. c. independent variable.
b. mean. d. dependent variable.
Question 2
In a graph of the relationship between the level of noise in an environment and the number of errors a person makes, the _____ is on the X axis and the _____ is on the Y axis.
a. mean number of errors; frequency of errors c. level of noise; frequency of noise
b. level of noise; mean number of errors d. mean number of errors; level of noise

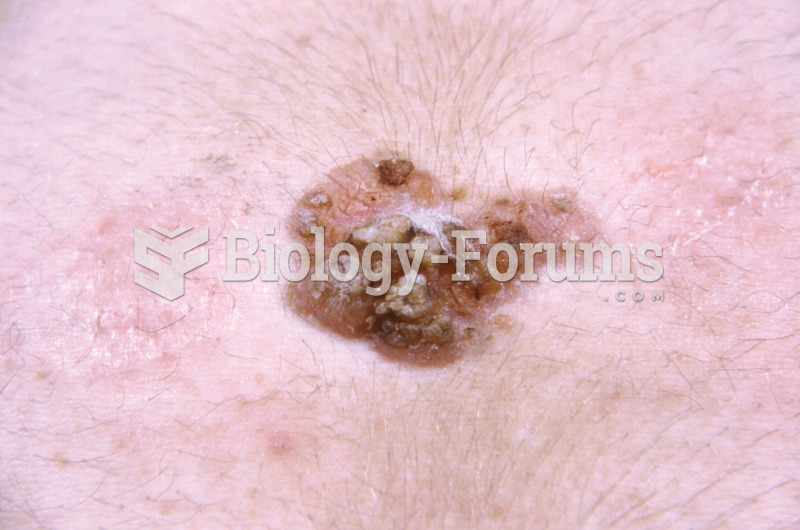 Basal cell carcinoma, a frequent type of skin cancer that rarely metastasizes.
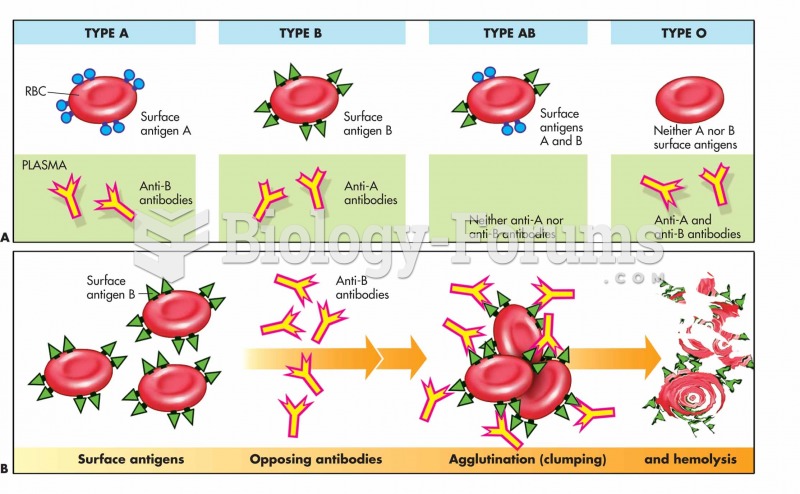 Blood-typing and cross-reactions: The blood type depends on the presence of surface antigens (agglut
 Gram Stain of a person's Gum line
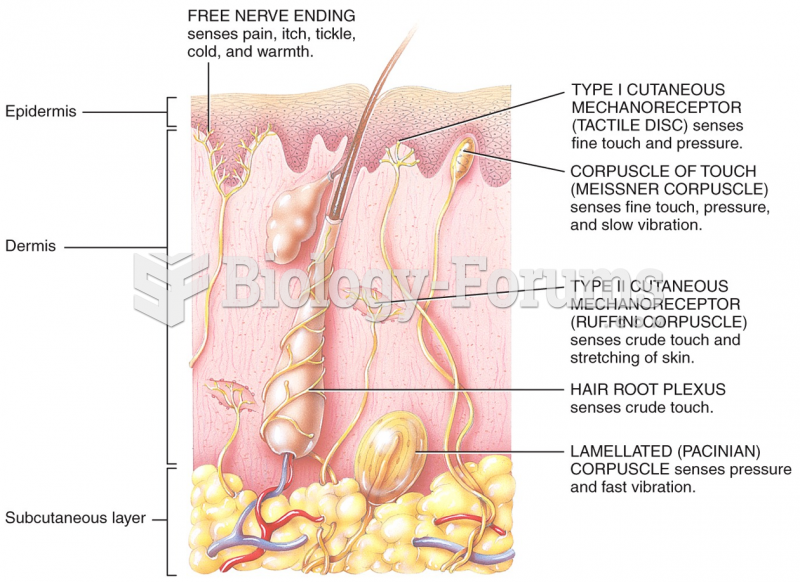 TYPE I and TYPE II CUTANEOUS MECHANORECEPTORS
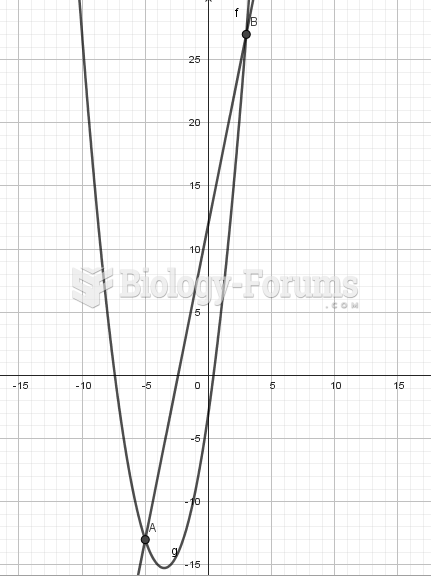 The line with the equation y=5x+12 intersects the parabola with equation y=xsqared+7x-3 at the ...
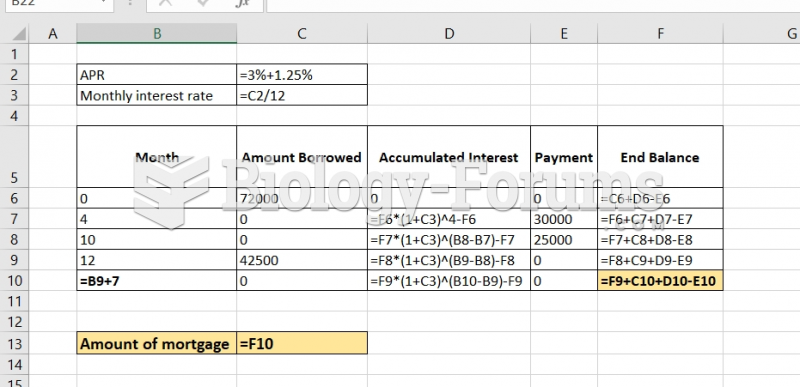 Raman has a line of credit loan with the ICICI bank. The initial loan balance was $72000.00. ...