This topic contains a solution. Click here to go to the answer
|
|
|

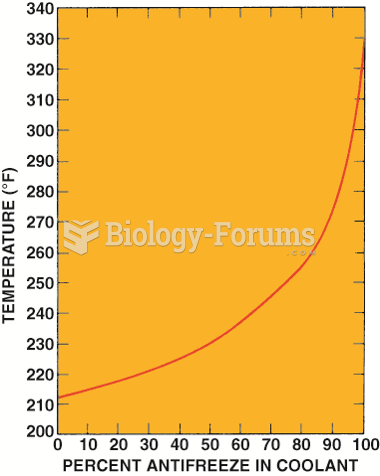 Graph showing how the boiling point of the coolant increases as the percentage of antifreeze in ...
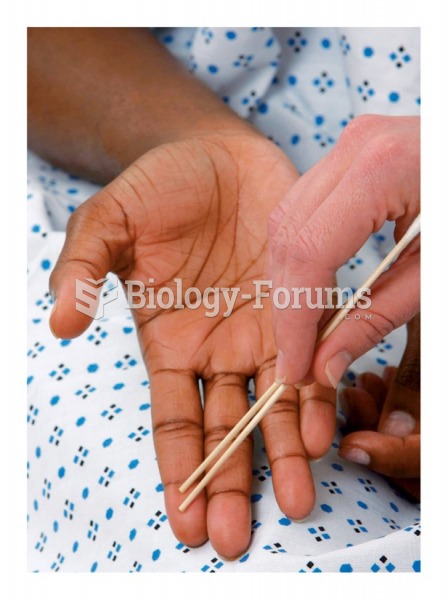 Two-point discrimination
 Nontraditional Gender Representation in Film
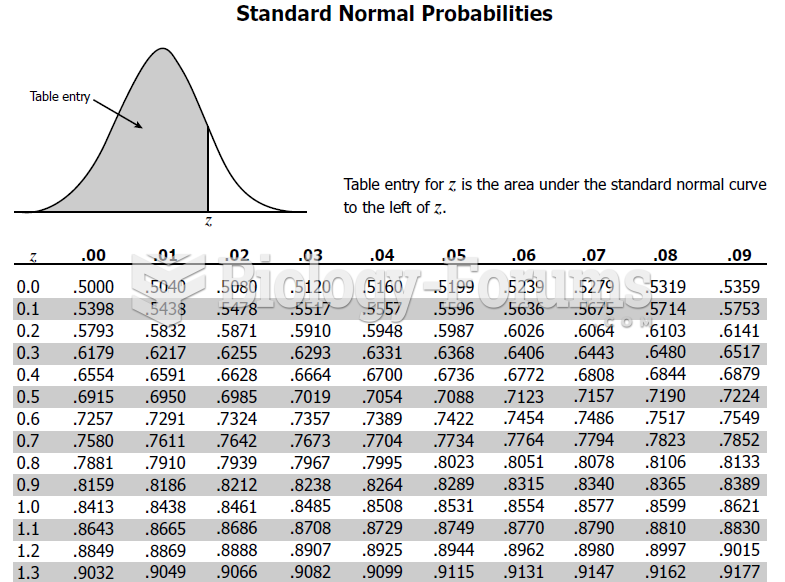 Assume z is a standard normal random variable. What is the value of z if the area to the right ...
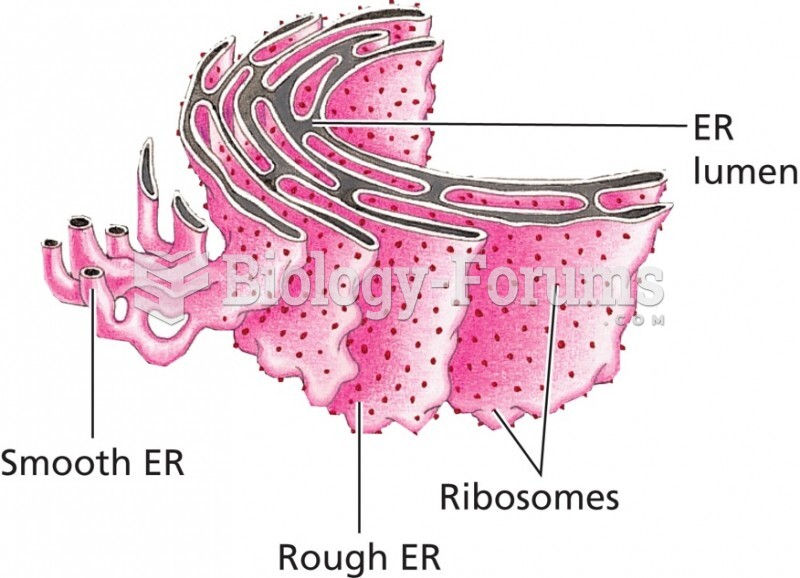 Three-dimensional representation of the endoplasmic reticulum (ER)
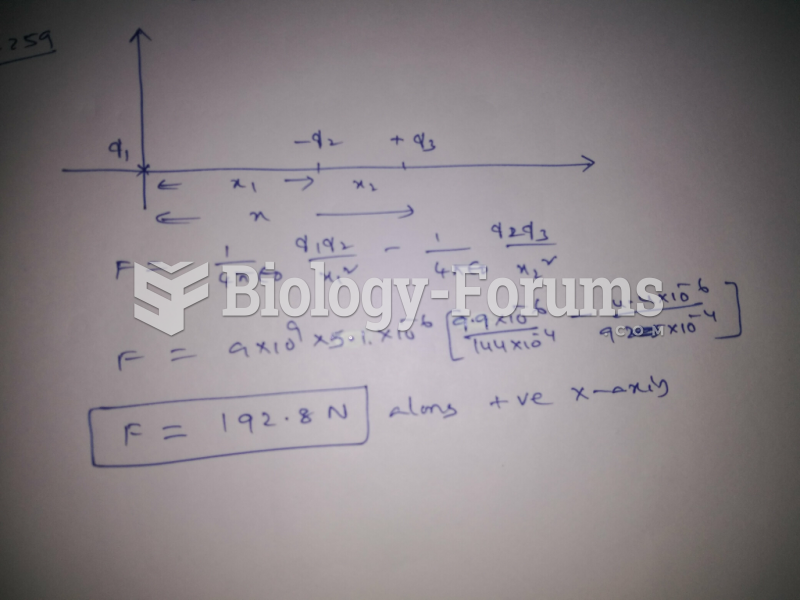 Three point charges lie on the x x axis. Charge 1 (+9.9 μC μ C ) is at the origin, ...