This topic contains a solution. Click here to go to the answer
|
|
|

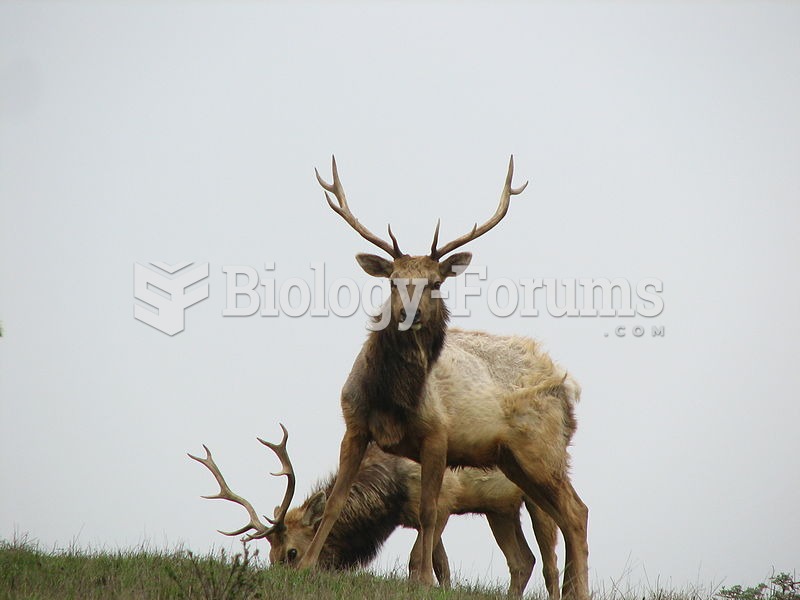 Male tule elk in Point Reyes
 POWER POINT PRESENTATION logo
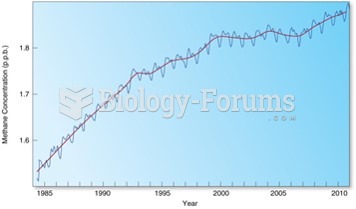 Variable Gases: Methane
 Trans Representation (1 of 3)
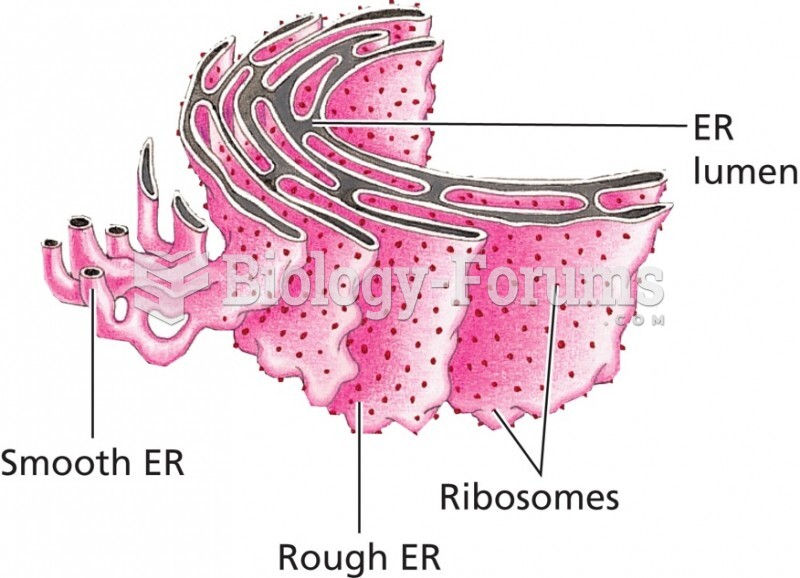 Three-dimensional representation of the endoplasmic reticulum (ER)
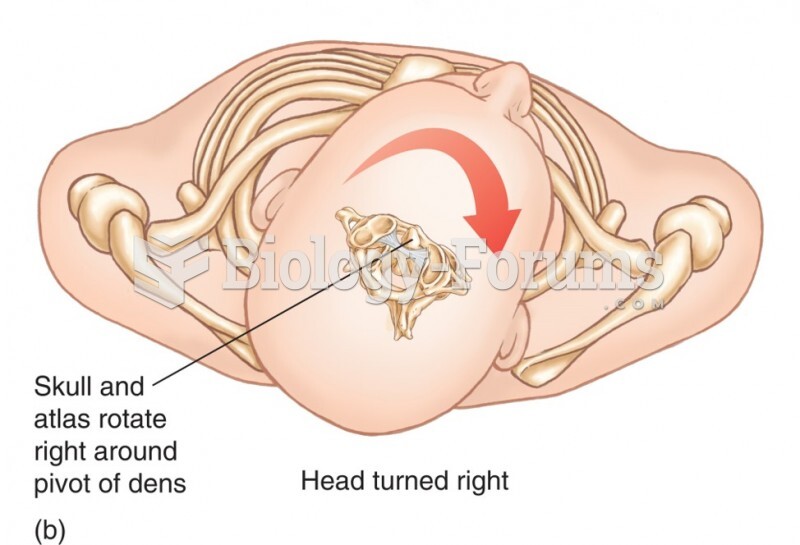 Relationship Between the Atlas and the Axis. The Dens of the Axis Provides a Pivotal Point Around Wh