This topic contains a solution. Click here to go to the answer
|
|
|

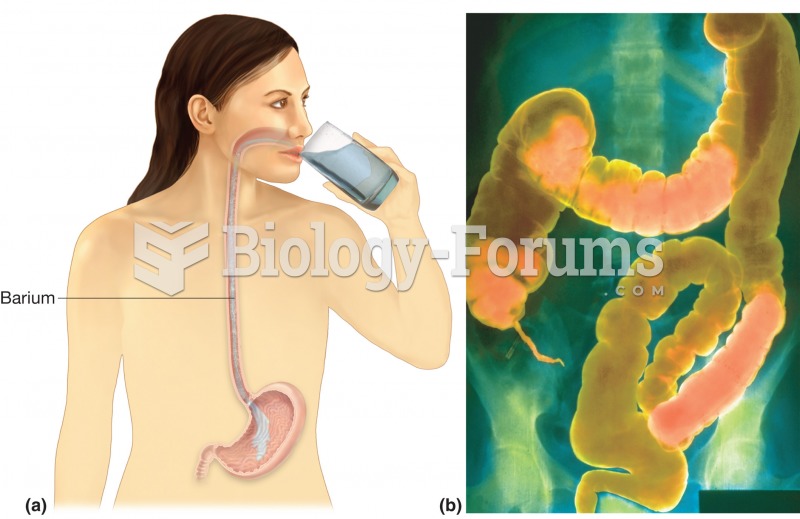 GI series. (a) Upper GI series begins with a barium swallow, barium shake, or barium meal. (b) Lower
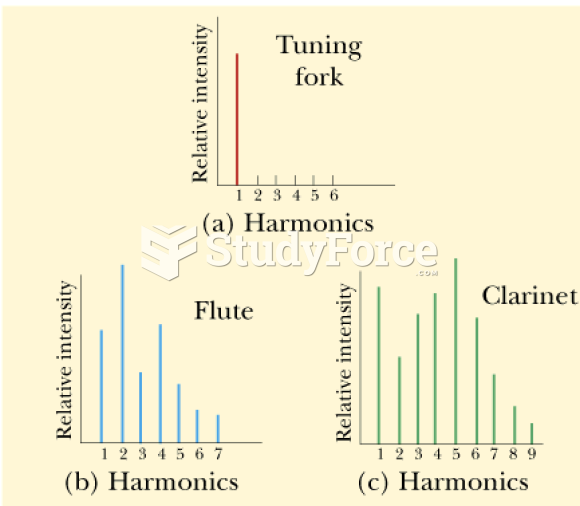 Fourier series - Complex Waves: Non-sinusoidal wave patterns
 Press into points along the neck with your thumb, one side at a time. Apply circular friction to ...
 Mechanism of the biotin-dependent pyruvate carboxylase reaction Phase I
 Determine if each function is continuous, If the function is not continuous, find the x-axis
 Mendel’s test cross to verify independent assortment