|
|
|

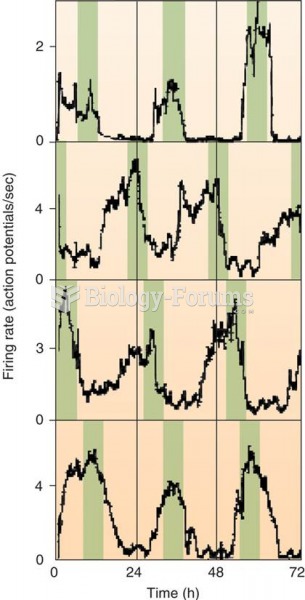 Firing Rate of Individual SCN Neurons in a Tissue Culture Color bars have been added to emphasize th
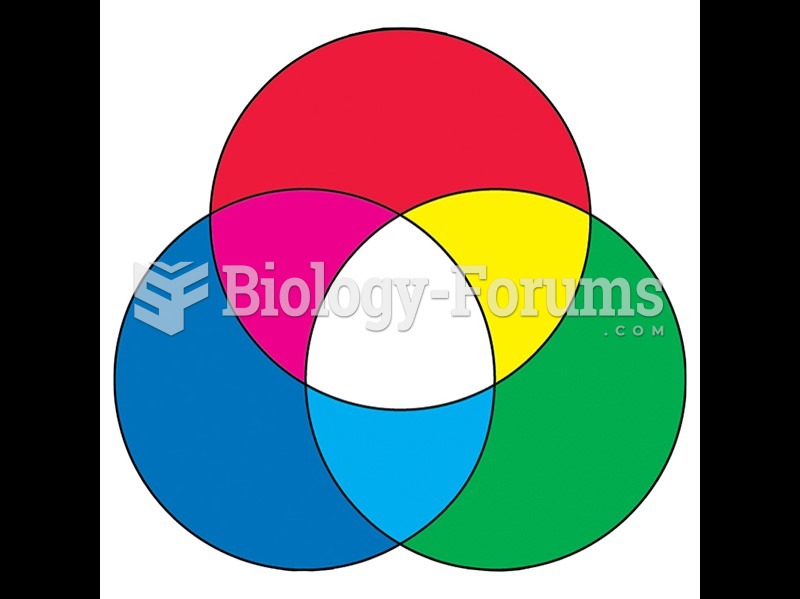 Color mixtures of refracted light—additive process.
 Positive velocity graph
 How to Graph Parametric Equations Manually
 Superior view of axis and right lateral view of axis
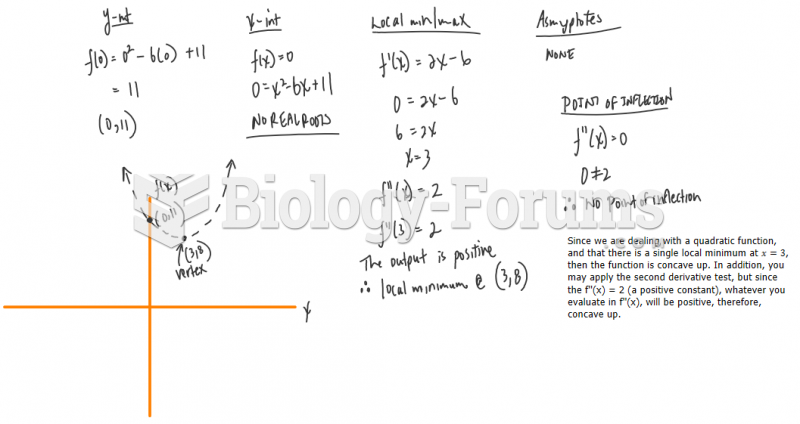 Sketch the graph of the following functions using local maximum/minimums, interc