|
|
|

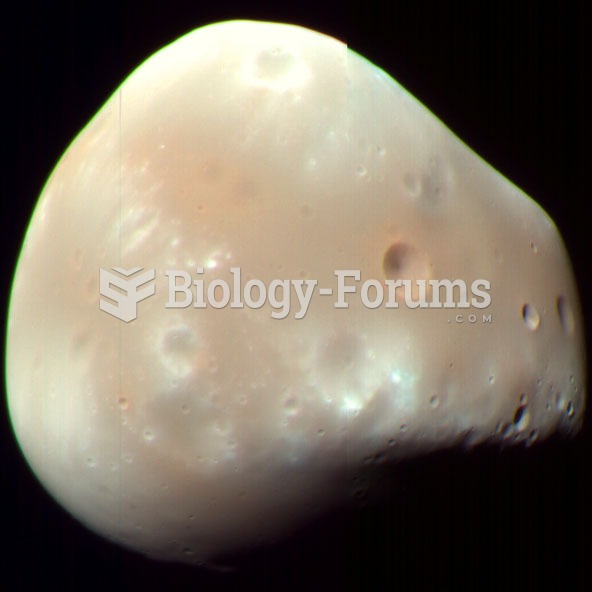 Deimos in color on February 21, 2009 by the same (not to scale)
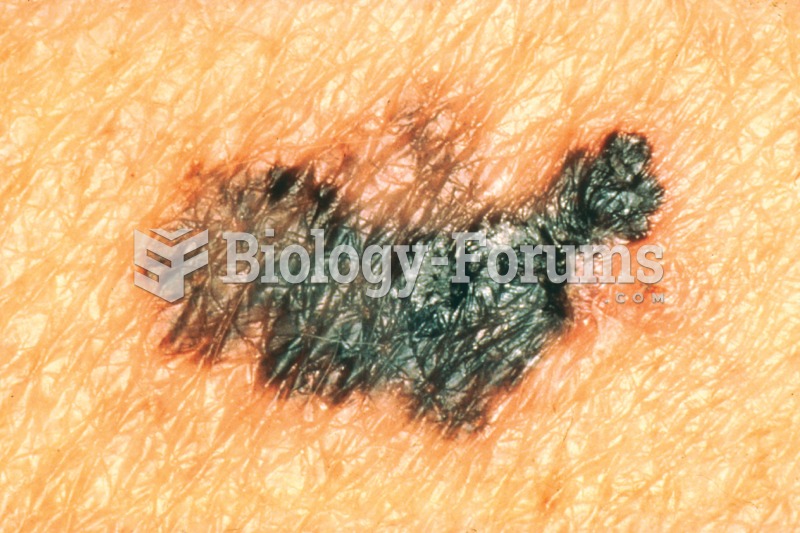 Malignant melanoma. This photograph demonstrates the highly characteristic color of this tumor.
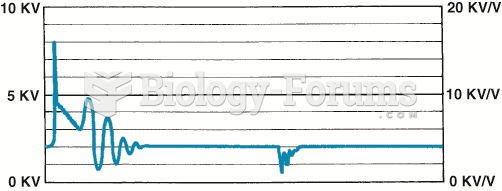 A downward-sloping spark line usually indicates high secondary ignition system resistance or an ...
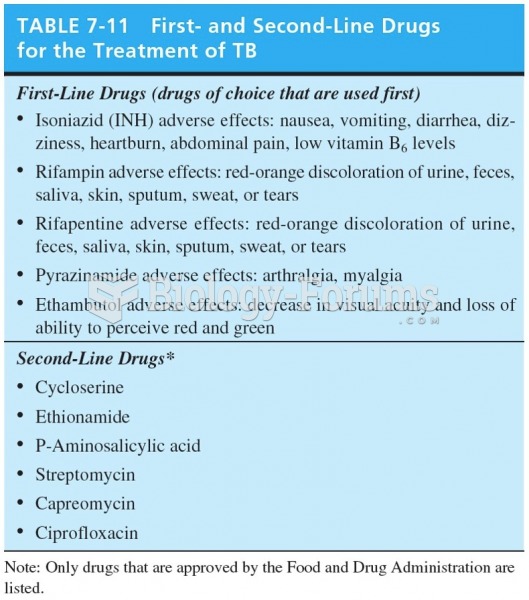 First and Second Line Drugs for the Treatment of TB
 Four color theorem
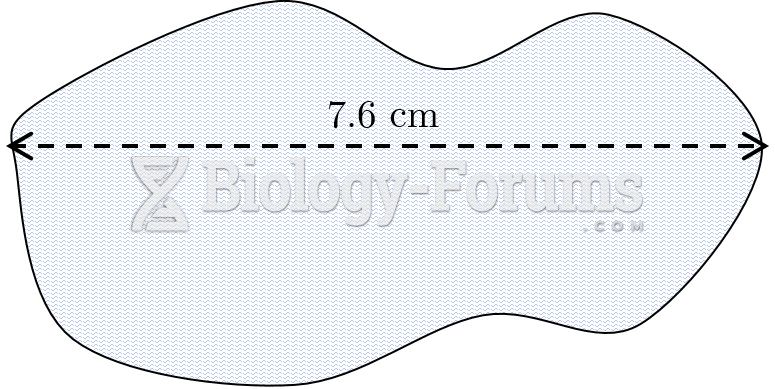 Offset Method Plot of Land with Length Line