|
|
|

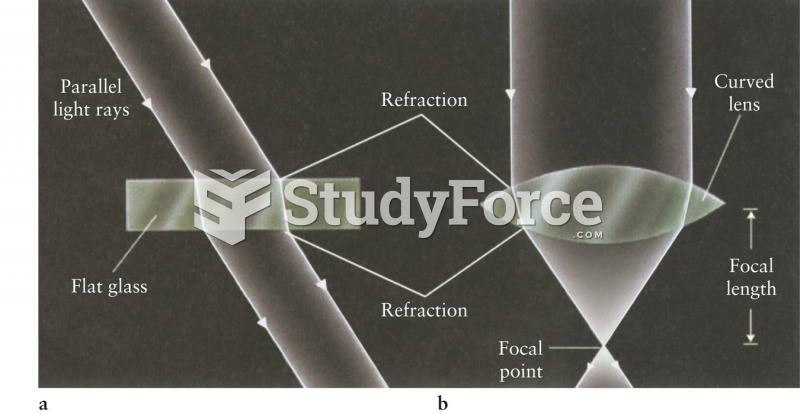 Refraction Through Uniform and Variable Thickness Glasses
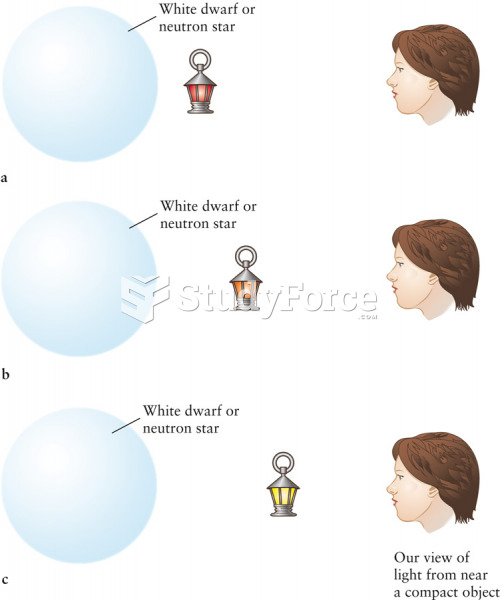 Gravitational Redshift The color of light from the same object located at diffe
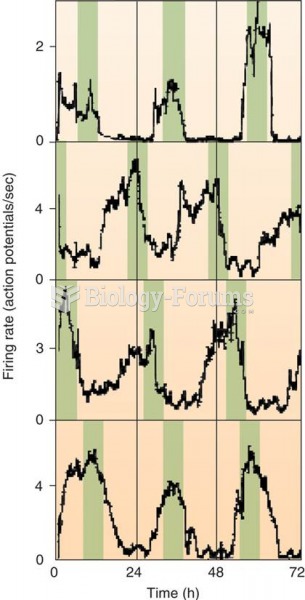 Firing Rate of Individual SCN Neurons in a Tissue Culture Color bars have been added to emphasize th
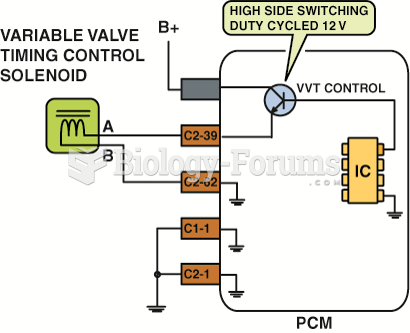 A variable valve timing solenoid being controlled by applying voltage from the PCM.
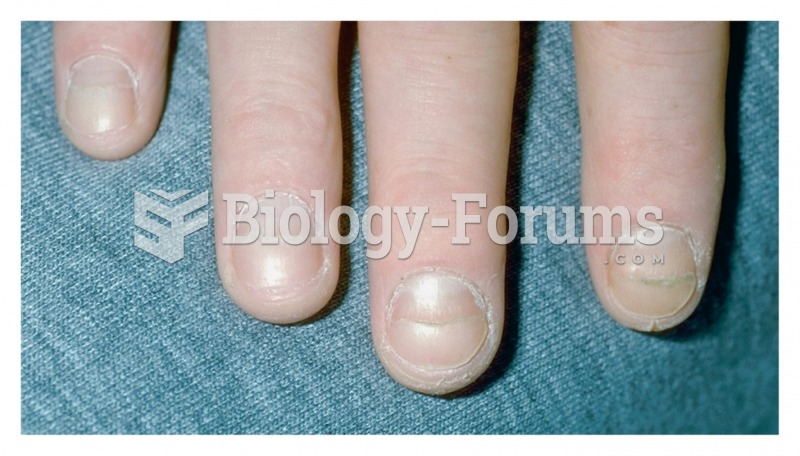 Beau’s line
 Coat color in mice