|
|
|

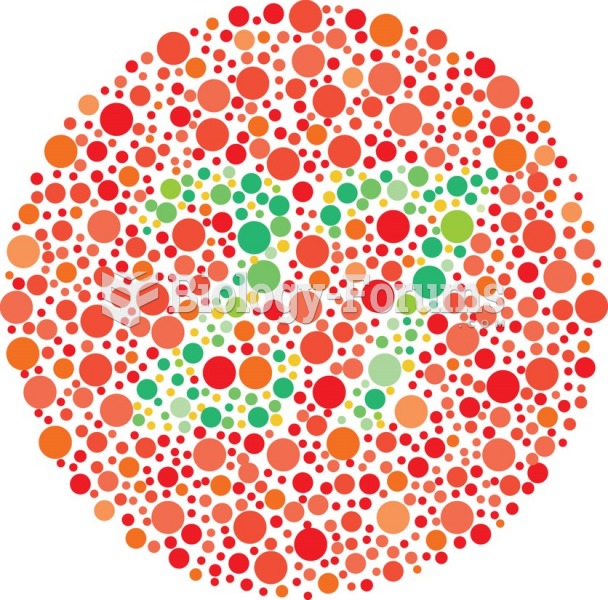 One page of color vision chart.
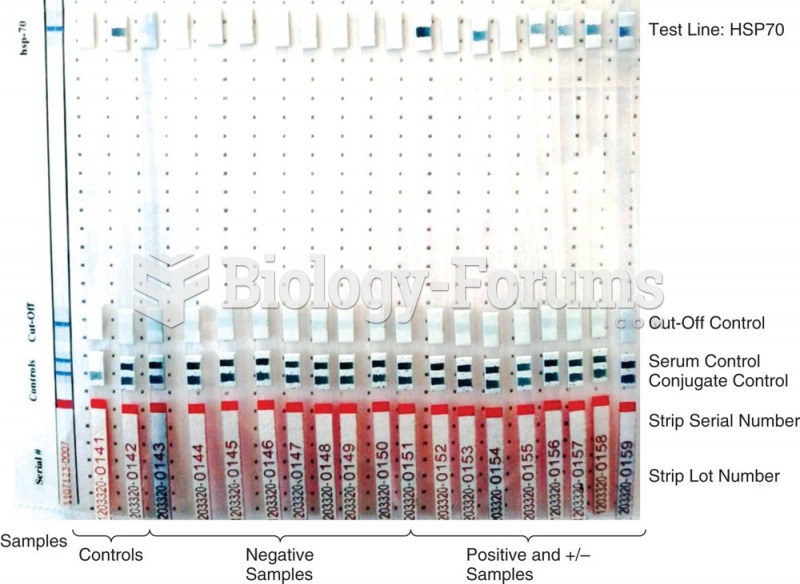 Line immunoassay (LIA), also recombinant immunoblot assay (RIBA) and Immuno-stripe, is similar to a ...
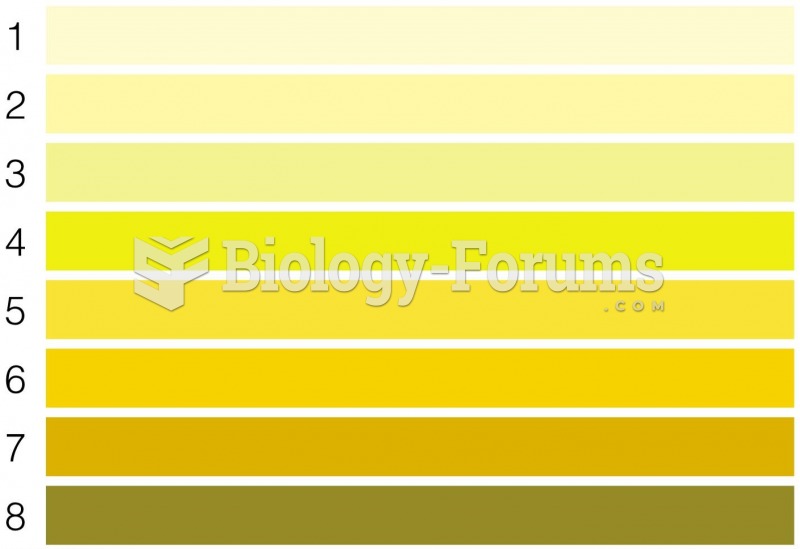 Urine Color Can Signal Dehydration
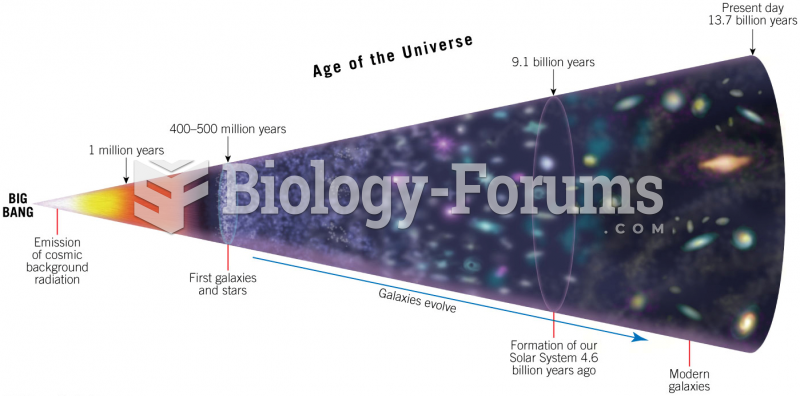 Time Line for Evolution of the Universe
 Three point charges lie on the x x axis. Charge 1 (+9.9 μC μ C ) is at the origin, ...
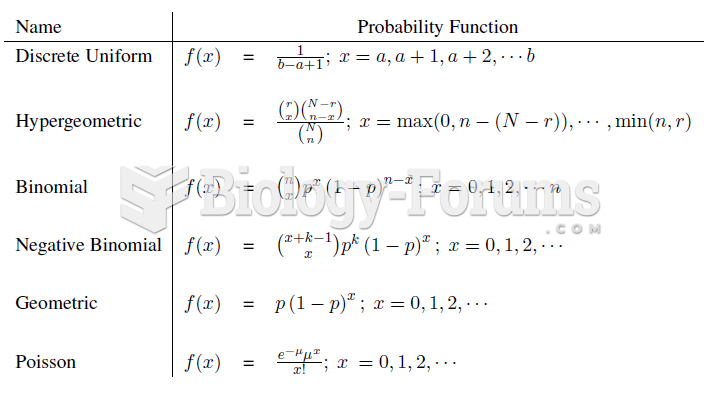 Summary of Single Variable Discrete Models