|
|
|

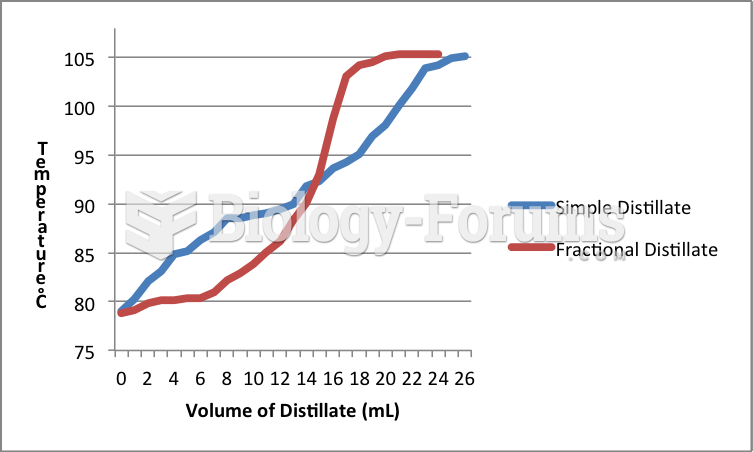 Distillation Graph Comparision
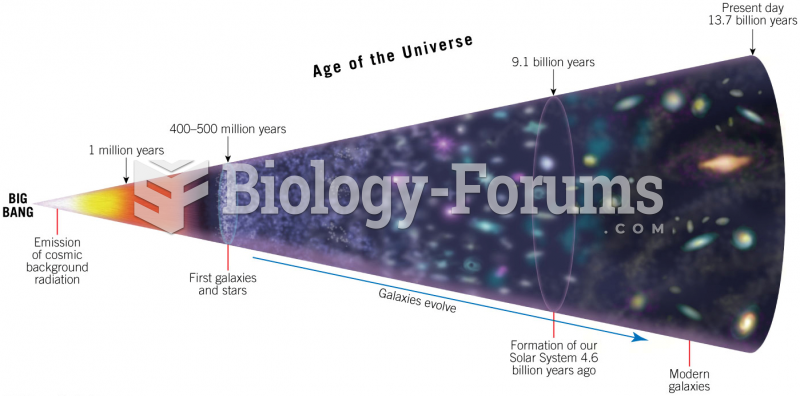 Time Line for Evolution of the Universe
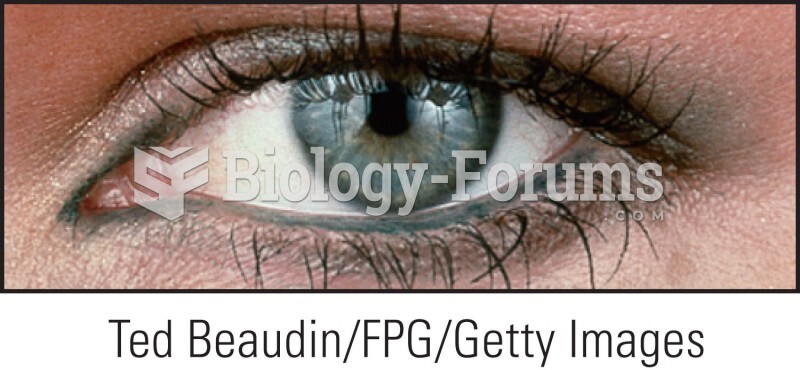 Light Green Eye Color
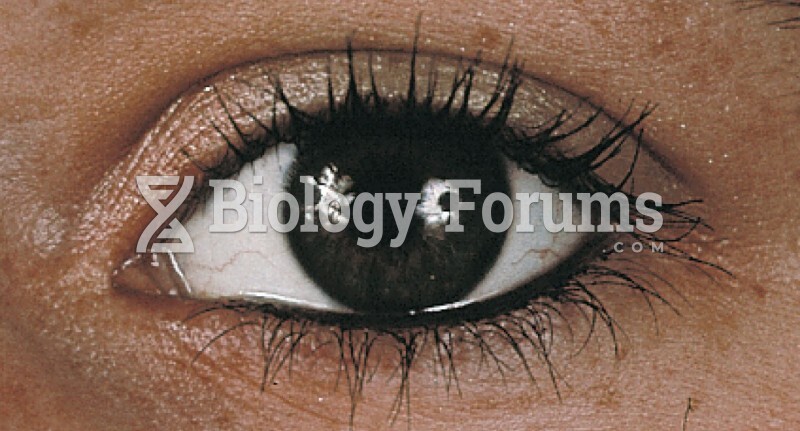 Dark Brown Eye Color
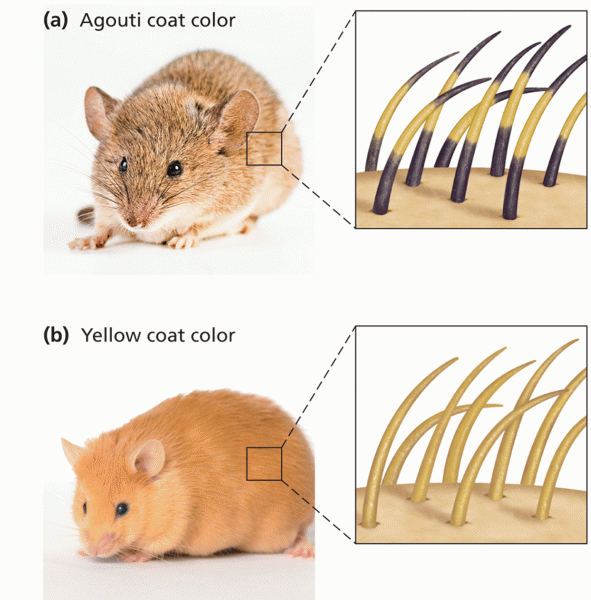 Coat color in mice
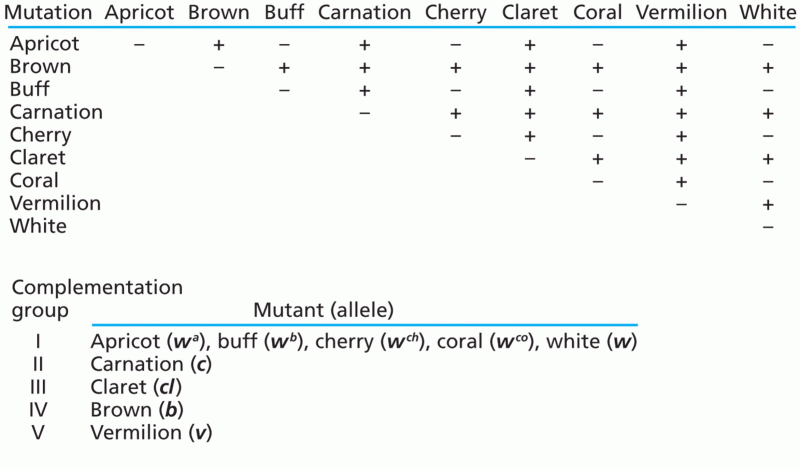 Genetic complementation analysis of Drosophila eye color mutants
|
|
|
Distillation Graph Comparision
Time Line for Evolution of the Universe
Light Green Eye Color
Dark Brown Eye Color
Coat color in mice
Genetic complementation analysis of Drosophila eye color mutants
For a complete list of videos, visit our video library