|
|
|

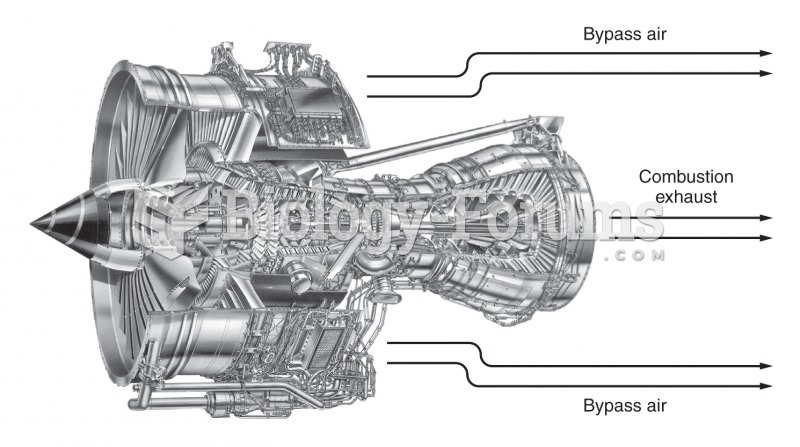 continuous combustion gas turbine
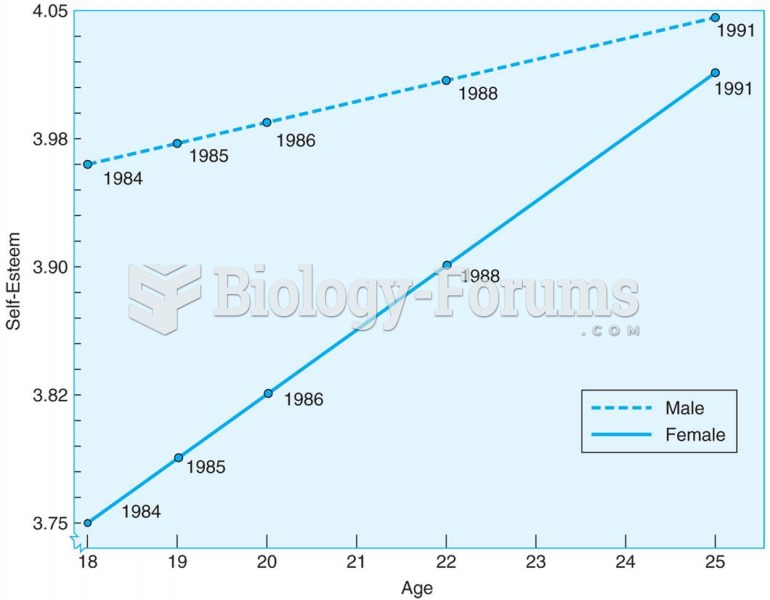 Young adults increase in self-esteem between the ages of 18 and 25, according to this longitudinal s
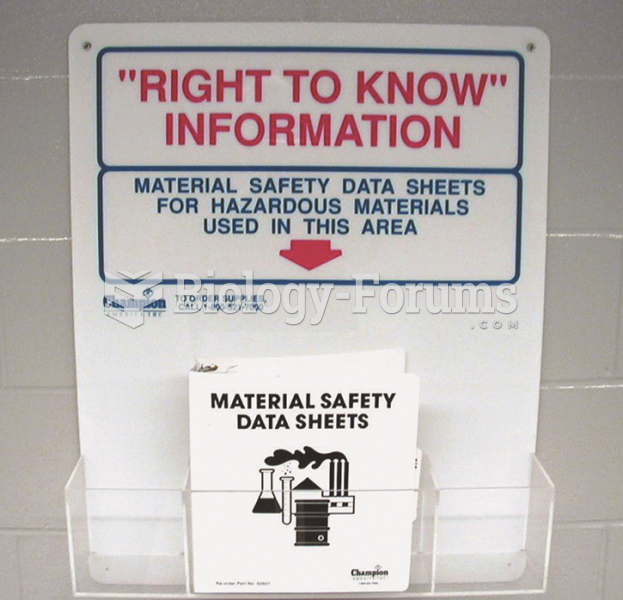 Material safety data sheets (MSDS), now called safety data sheets (SDS), should be readily available ...
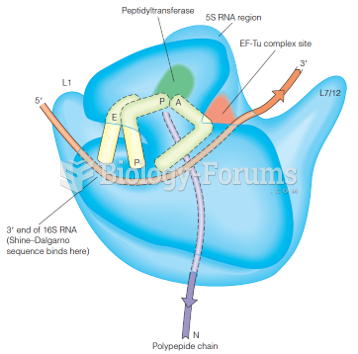 A model of the 70S ribosome based upon early structural data
 Business Intelligence, Analytics, and Data Science: A Managerial Perspective, 4th Edition
 Picture graph