|
|
|

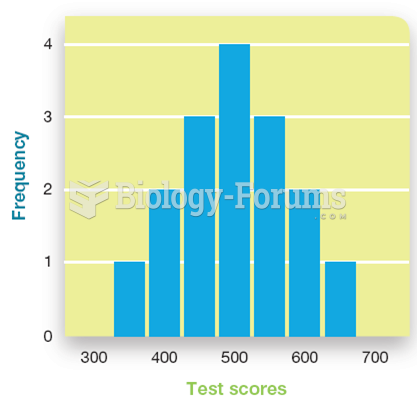 Graphing Psychological Data
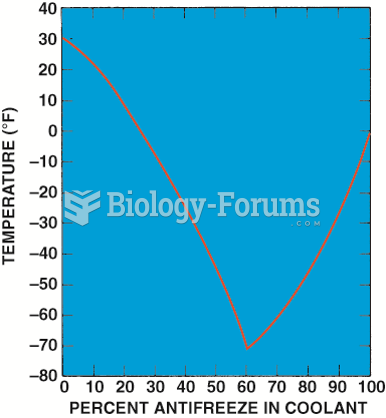 Graph showing the relationship between the freezing point of the coolant and the percentage of ...
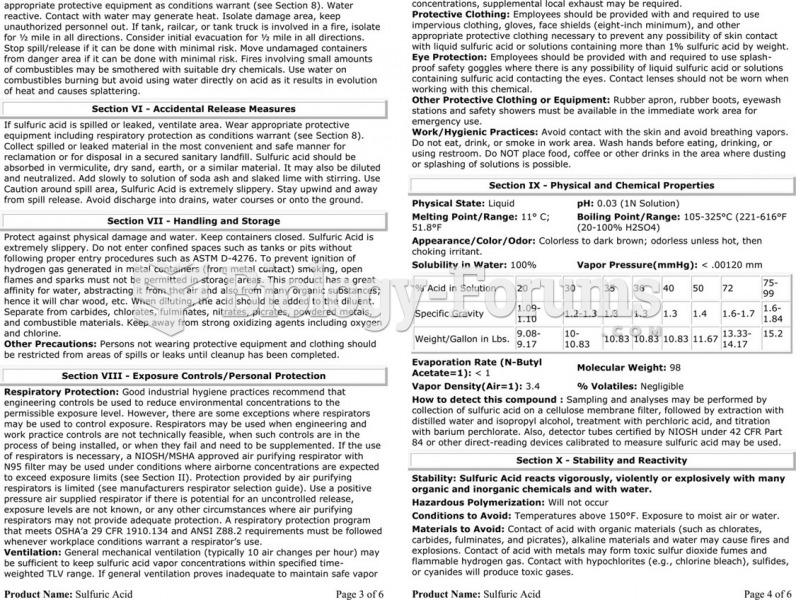 The material safety data sheet (MSDS) for sulfuric acid showing the detailed technical information ...
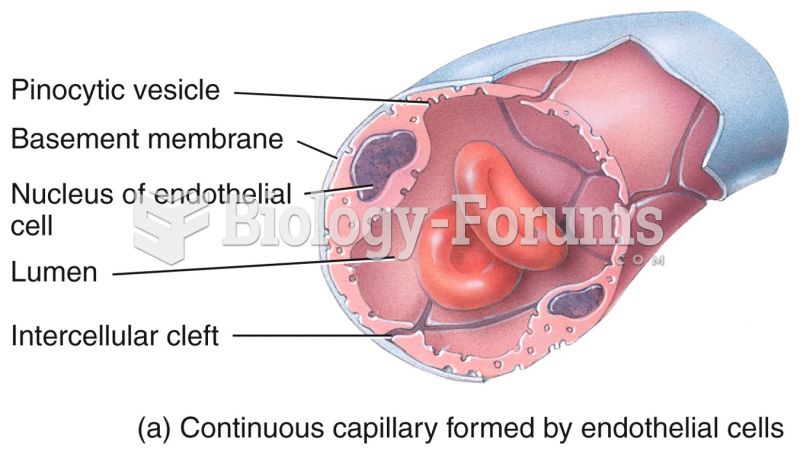 Continuous capillaries
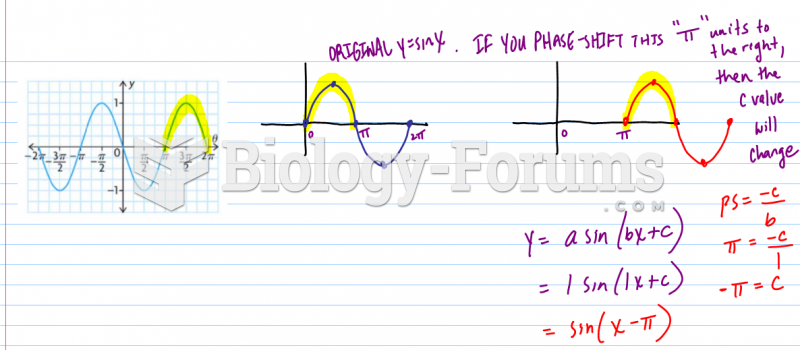 How to find the possible equations of a graph?
 Quantitative trait locus (QTL) detection and mapping