This topic contains a solution. Click here to go to the answer
|
|
|

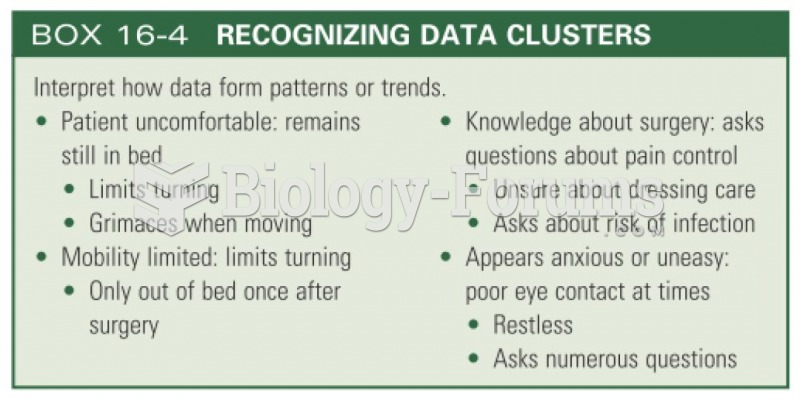 Recognizing data clusters
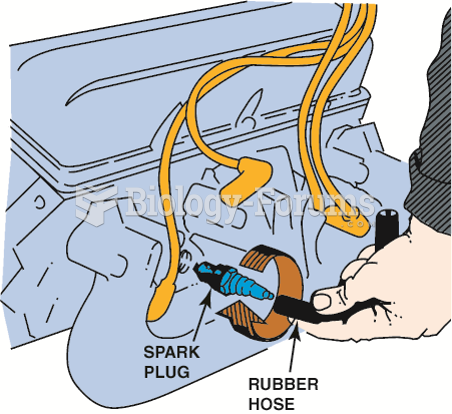 Use a vacuum or fuel line hose over the spark plug to install it without danger of cross-threading ...
 How to calculate monthly mortgage payments at varying amortization periods (Question 1)
 People are living longer today than in previous decades
 Electric Light Orchestra (ELO) - Telephone Line + Lyrics
 economic question