|
|
|

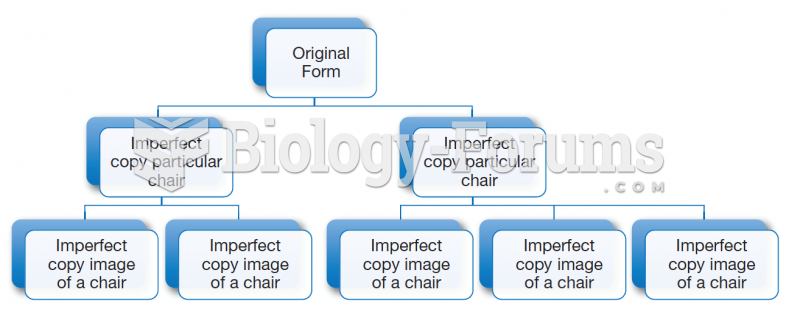 Relation between form, particular objects, and images in Plato’s Line.
 Demographic Data for Nigeria
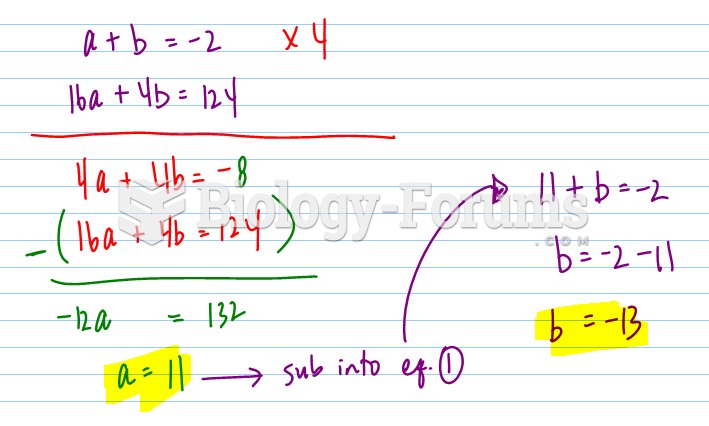 Solving linear system by elimination
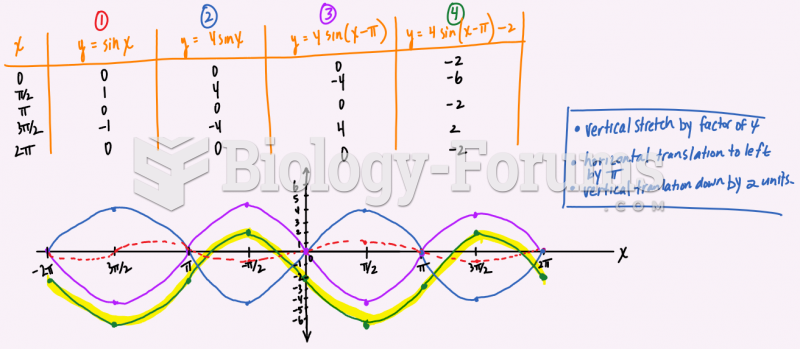 State the transformations on the function f(x)= 4sin(x-pi)-2 and then graph two cycles below.
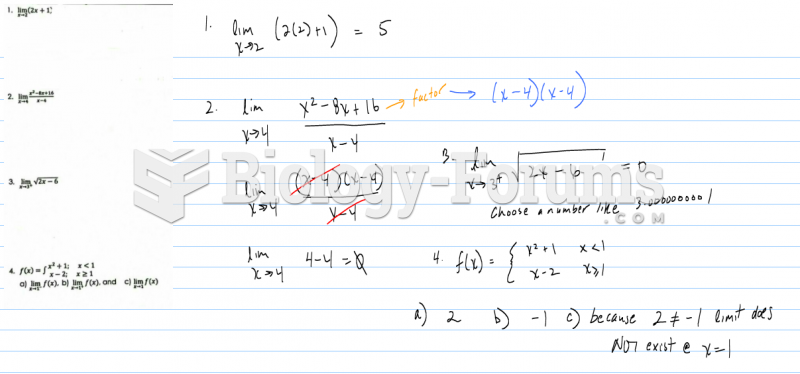 Evaluate then graph the following limits
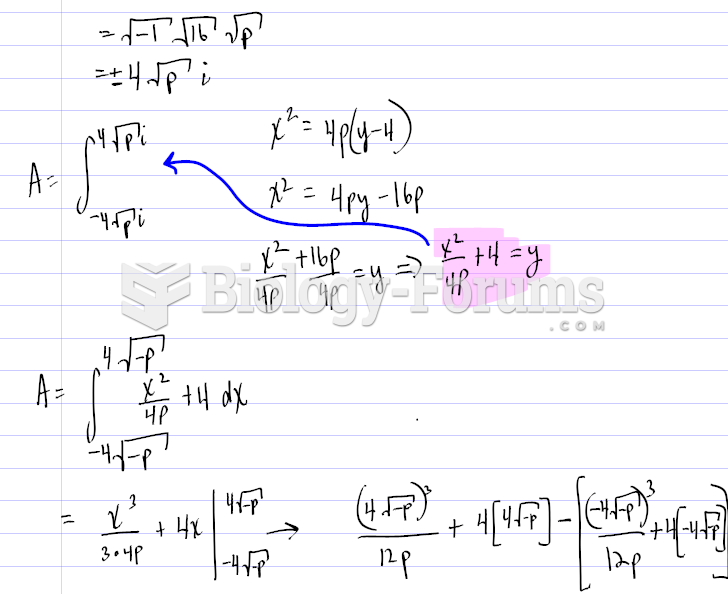 Finding the graph of a Parabola using certain values