|
|
|

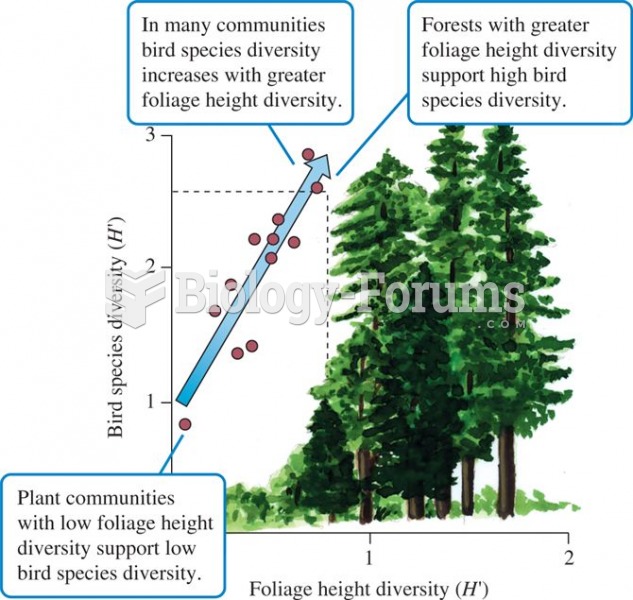 Foliage height diversity and bird species diversity (data from MacArthur and MacArthur 1961).
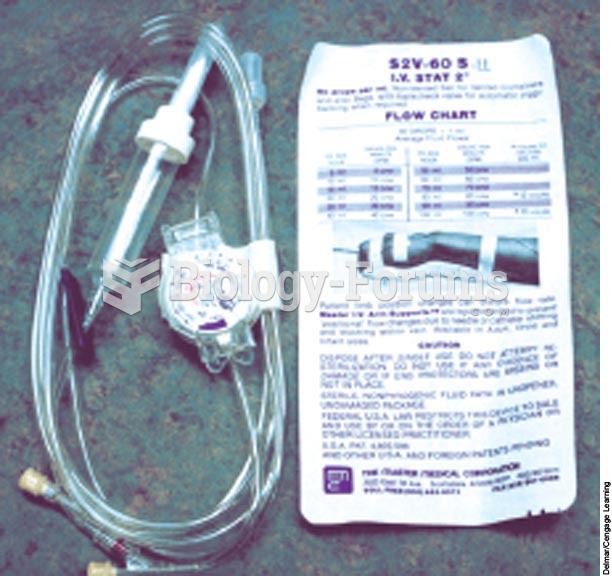 Dial-A-Flo in-line device to regulate IV flow.
 Business Intelligence, Analytics, and Data Science: A Managerial Perspective, 4th Edition
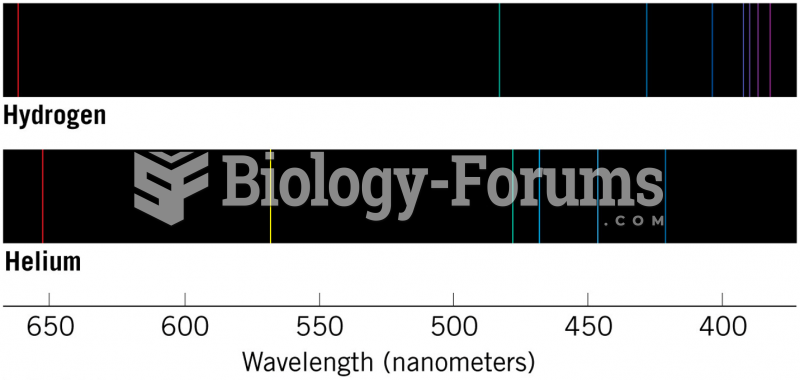 Bright-Line Spectra of Hydrogen and Helium
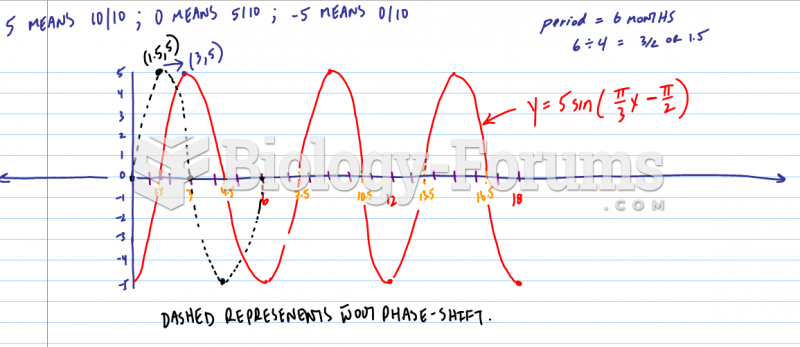 Sketch a graph of the function h(x), by hand on the following interval:
 Data for a Hypothetical Paternity Test Using 13 CODIS Genes