A researcher collects a sample of n = 20 Introductory Psychology textbooks and records the number of pages in each book. The results are then placed in a grouped frequency distribution table using intervals of 0-99 pages, 100-199 pages, 200-299 pages, and so on. If the results were converted into a frequency distribution graph, what kind of graph should be used?
a. A bar graph c. A polygon
b. A histogram d. Either a histogram or a polygon
Question 2
A researcher surveys a sample of n = 200 college students and asks each person to identify his or her favorite movie from the past year. If the results were presented in a frequency distribution graph, what kind of graph would be appropriate?
a. A histogram c. A histogram or a polygon
b. A polygon d. A bar graph

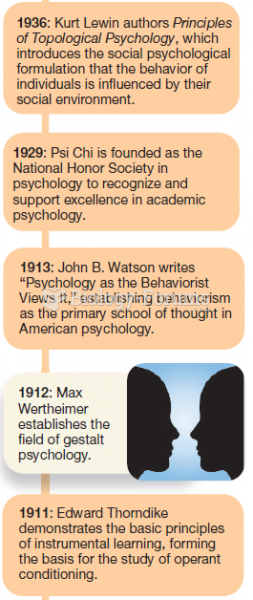 Major Events in the History of Psychology (4 of 6)
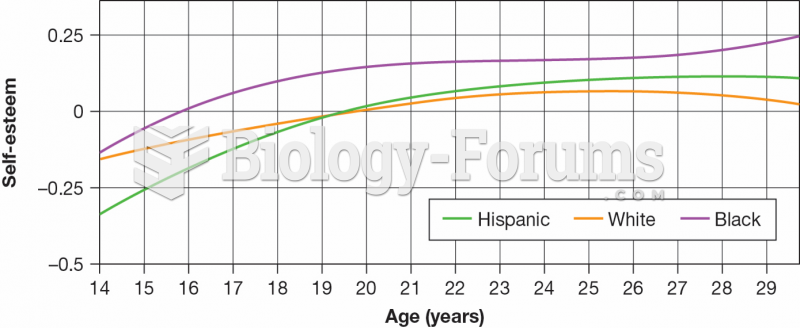 Self-Esteem in a Longitudinal Sample
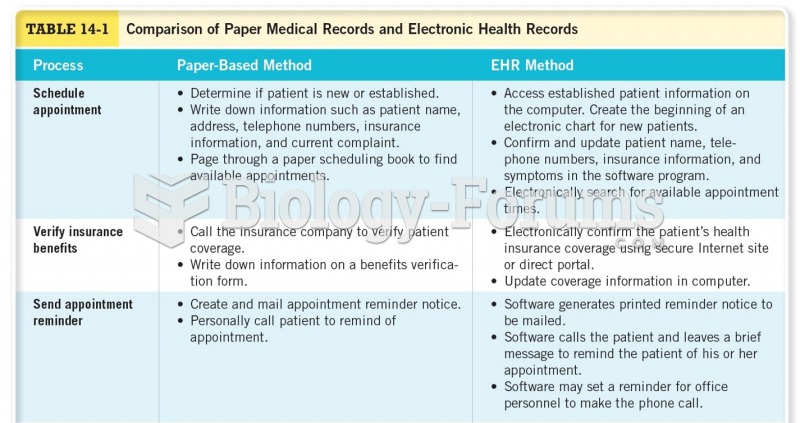 Comparison of Paper Medical Records and Electronic Health Records
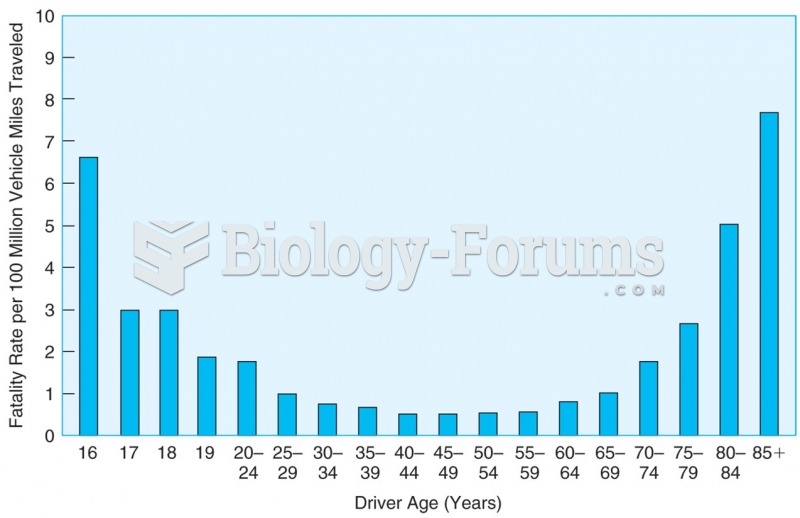 When the number of miles traveled is considered, drivers under 25 years of age and those over 70 are ...
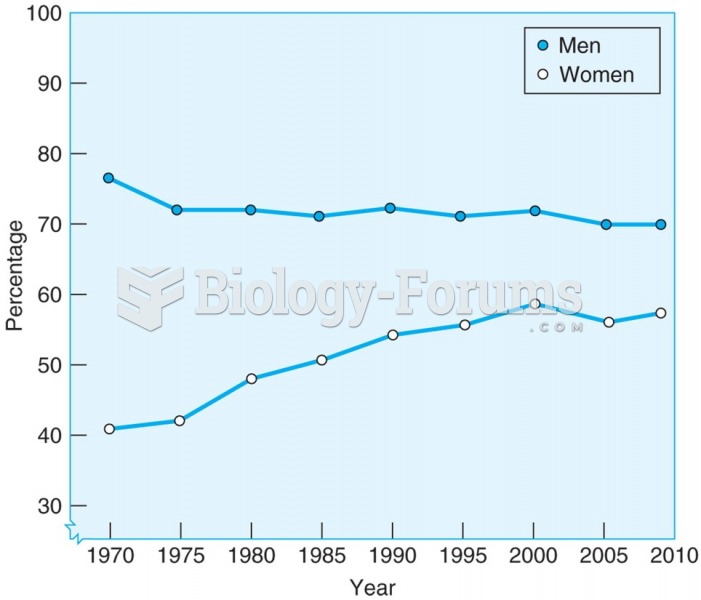 A greater number of men than women hold full-time jobs, but the gap is closing because of an ...
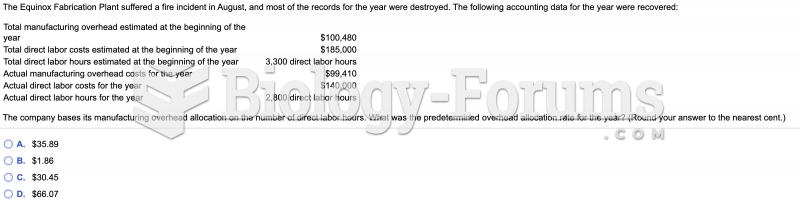 The Equinox Fabrication Plant suffered a fire incident in August, and most of the records for ...