A researcher collects a sample of n = 20 Introductory Psychology textbooks and records the number of pages in each book. The results are then placed in a grouped frequency distribution table using intervals of 0-99 pages, 100-199 pages, 200-299 pages, and so on. If the results were converted into a frequency distribution graph, what kind of graph should be used?
a. A bar graph c. A polygon
b. A histogram d. Either a histogram or a polygon
Question 2
A researcher surveys a sample of n = 200 college students and asks each person to identify his or her favorite movie from the past year. If the results were presented in a frequency distribution graph, what kind of graph would be appropriate?
a. A histogram c. A histogram or a polygon
b. A polygon d. A bar graph

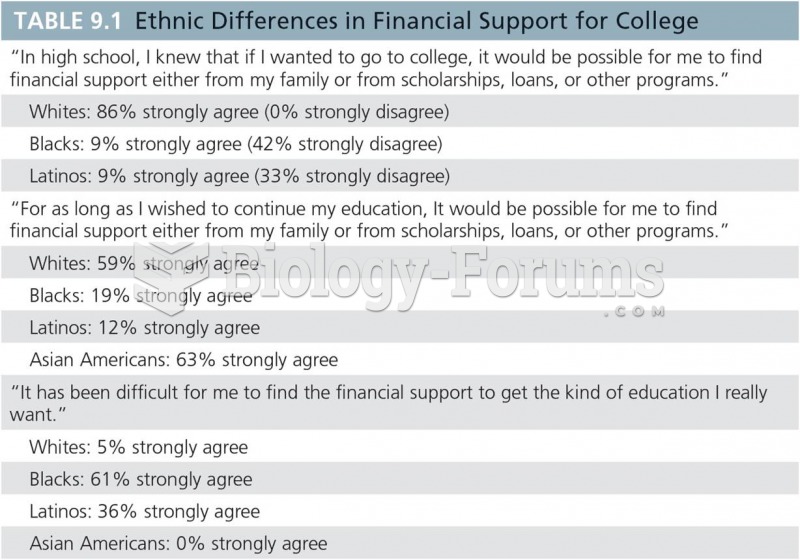 Ethnic Differences in Financial Support for College Based on a sample of 304 emerging adults aged 2
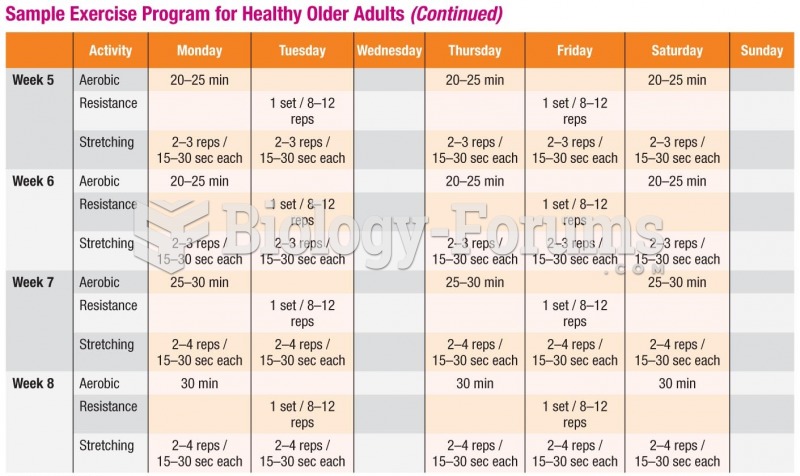 Sample Exercise Program for Healthy Older Adults (cont.)
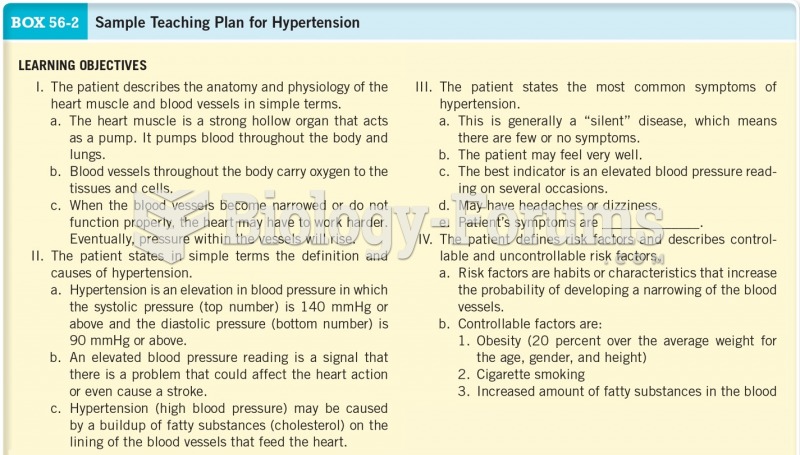 Sample Teaching Plan for Hypertension Cont.
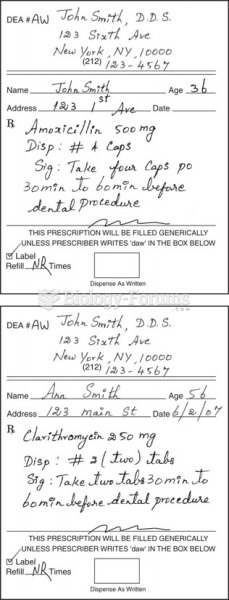 Sample prescriptions of antibiotics for prophylaxis against infective endocarditis.
 Psychology and Life
![What is the [OH-] in a seawater sample if the pH is 8.65?](https://biology-forums.com/gallery/43/medium_6_11_01_22_1_38_03.png) What is the [OH-] in a seawater sample if the pH is 8.65?
What is the [OH-] in a seawater sample if the pH is 8.65?