This topic contains a solution. Click here to go to the answer
|
|
|

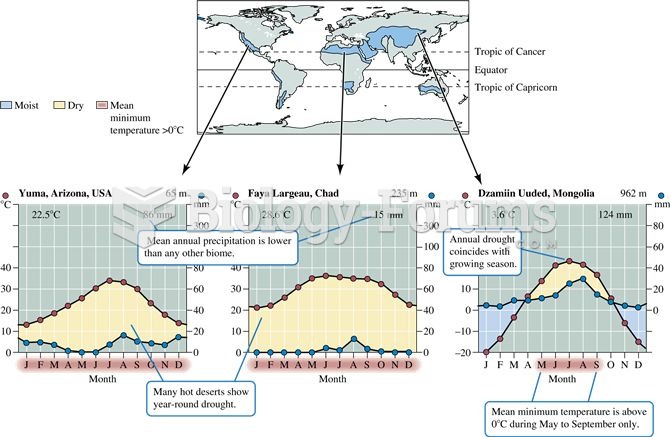 Desert distribution and climate
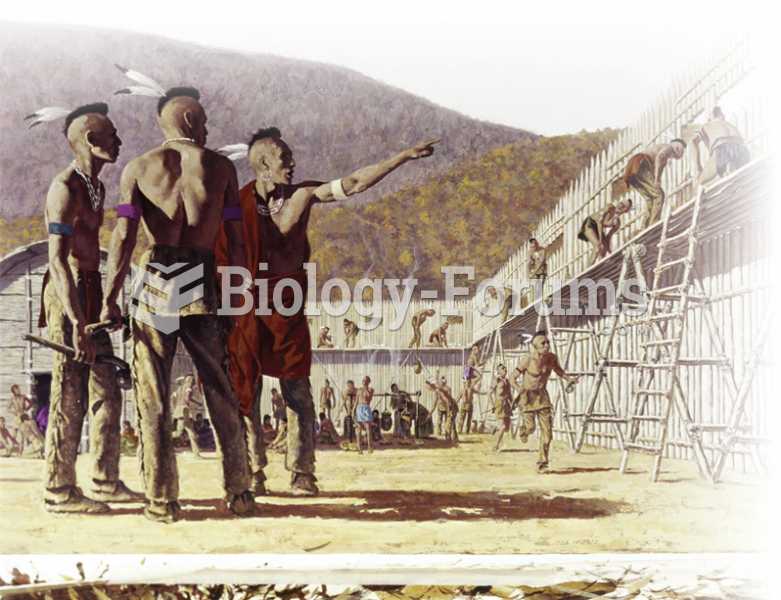 This depiction breaks stereotypes, but is historically accurate. Shown here is an Iroquois fort. Can ...
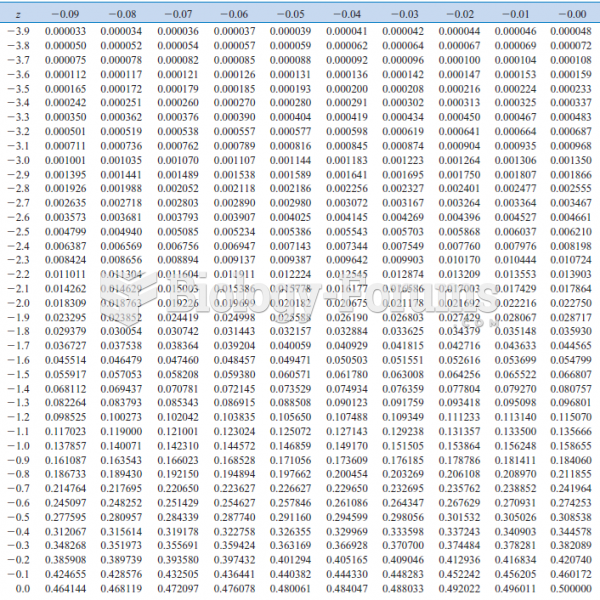 Cumulative Standard Normal Distribution
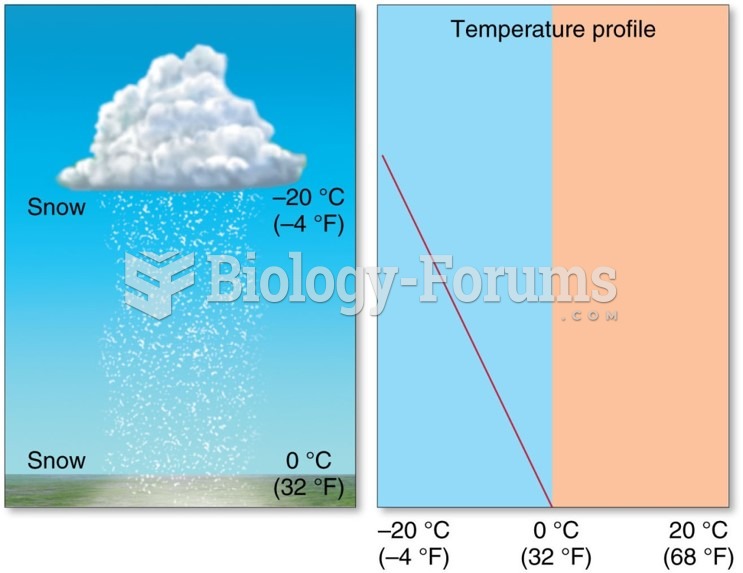 Distribution and Forms of Precipitation: Snow
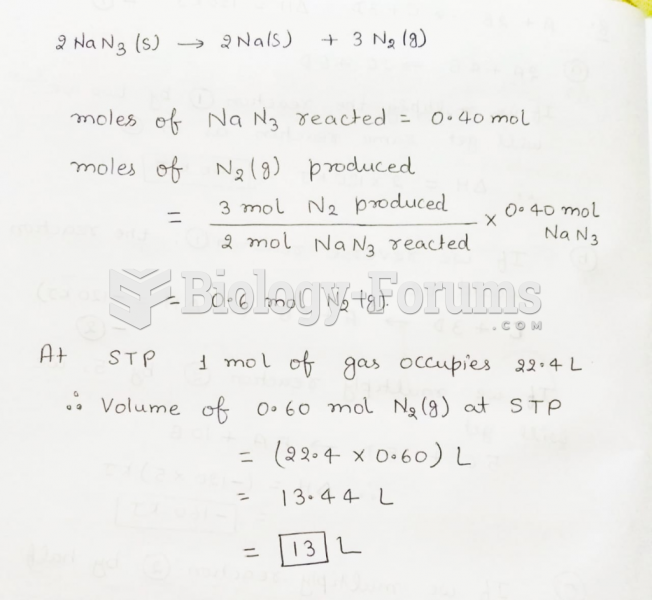 If 0.40 mol of NaN3 reacts completely in the reaction shown below, then ________ L of N2 will ...
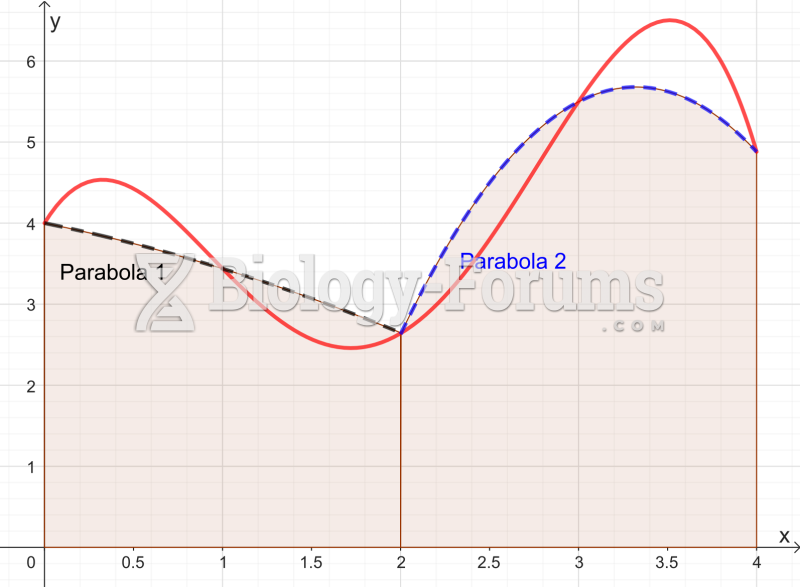 Graph approximated by two parabolas for the Simpson's rule