This topic contains a solution. Click here to go to the answer
|
|
|

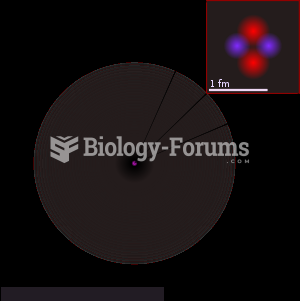 An illustration of the helium atom, depicting the nucleus (pink) and the electron cloud distribution
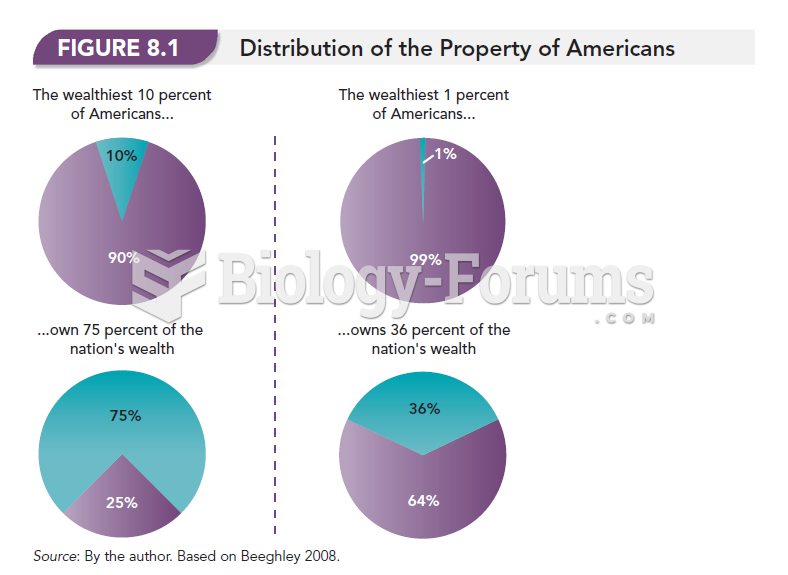 Distribution of the Property of Americans
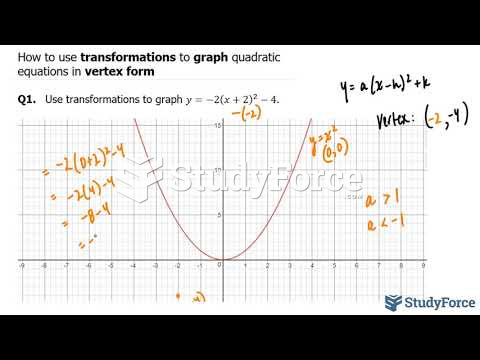 How to use transformations to graph quadratic equations in vertex form
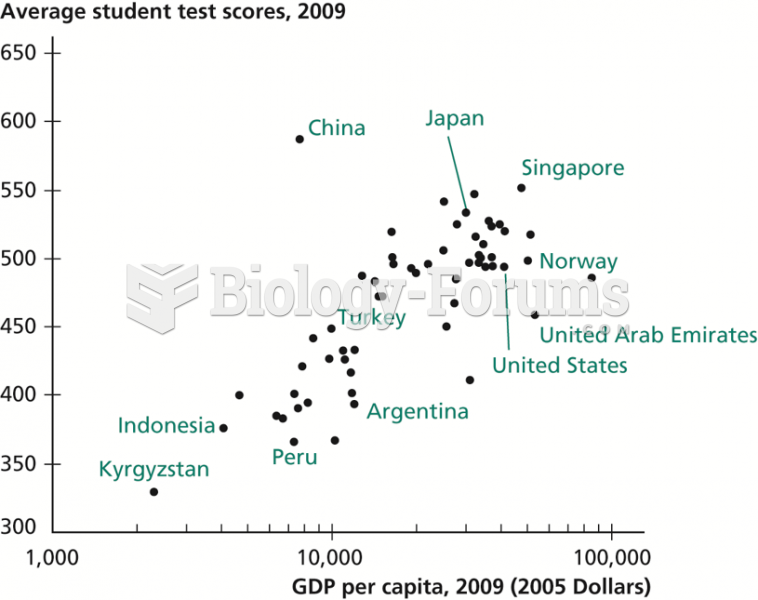 Student Test Scores versus GDP per Capita
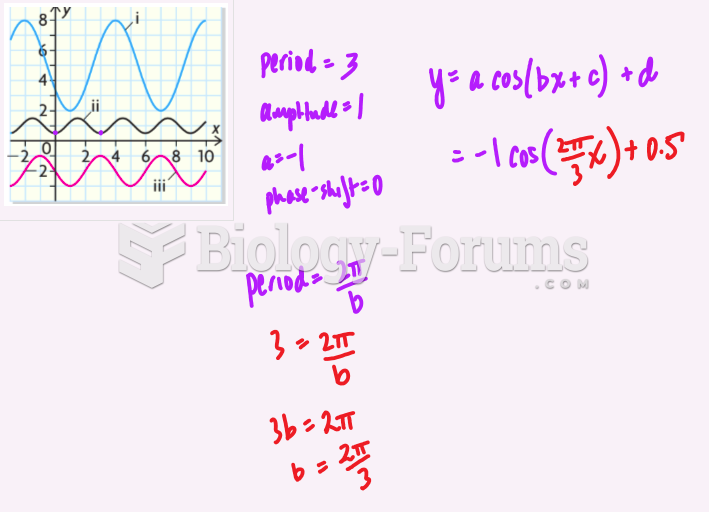 Graph to Function Cosine
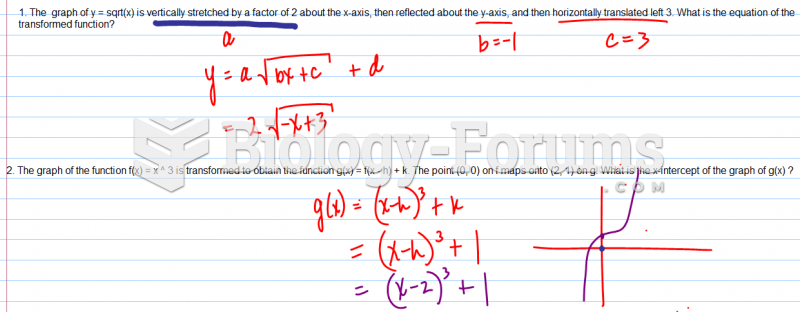 The graph of y = sqrt(x) is vertically stretched by a factor