This topic contains a solution. Click here to go to the answer
|
|
|

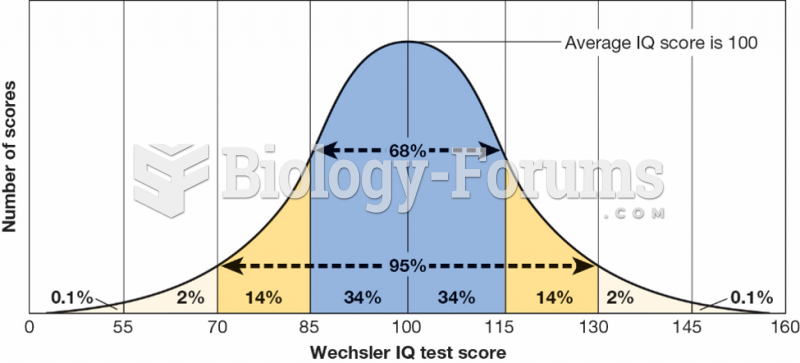 Normal Distribution of IQ Scores
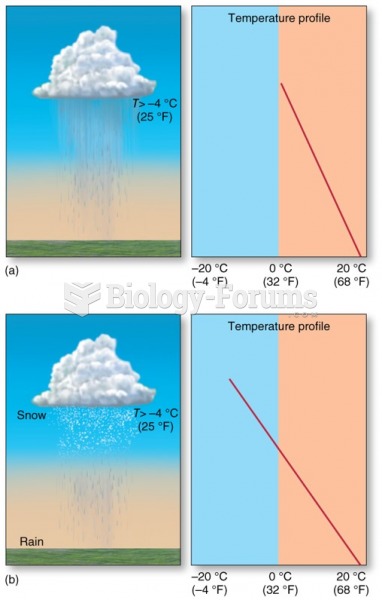 Distribution and Forms of Precipitation: Rain
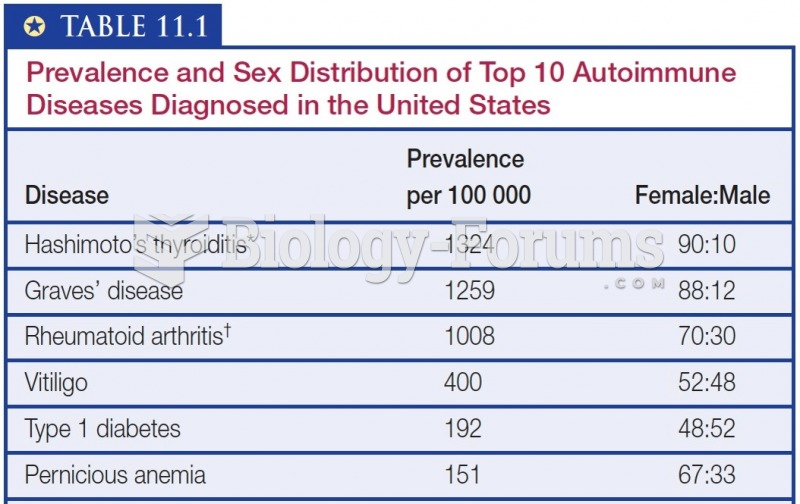 Prevalence and Sex Distribution of Top 10 Autoimmune Diseases Diagnosed in the United States
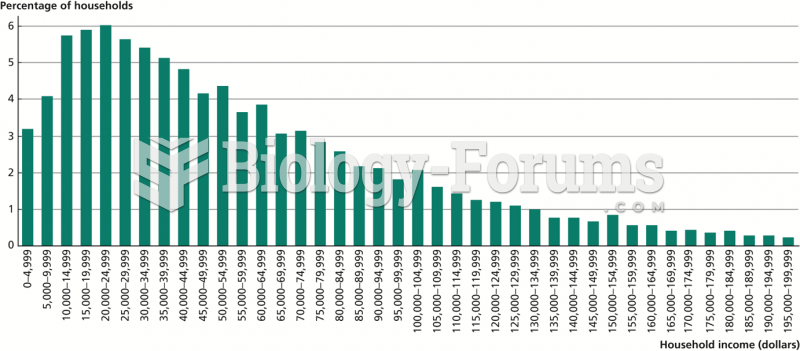 Income Distribution in the United States, 2009
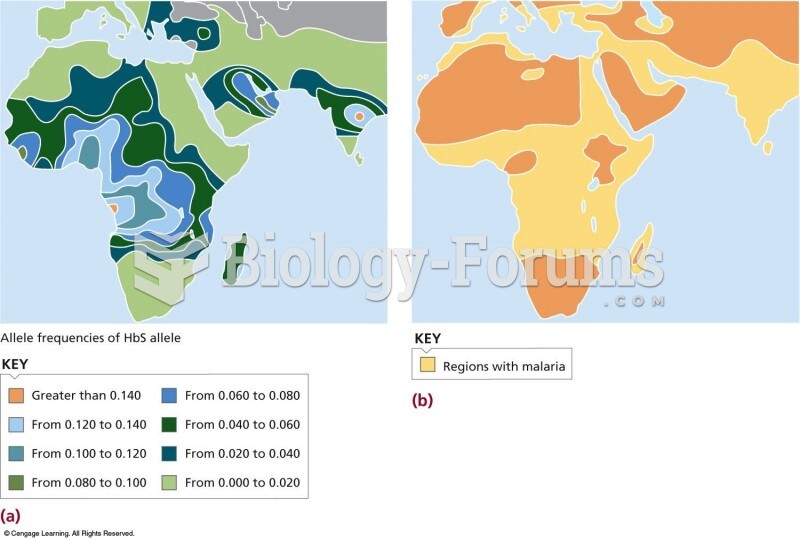 (a) The distribution of sickle cell anemia in the Old World. (b) The distribution of malaria overlap
 calculus homework graph help please