This topic contains a solution. Click here to go to the answer
|
|
|

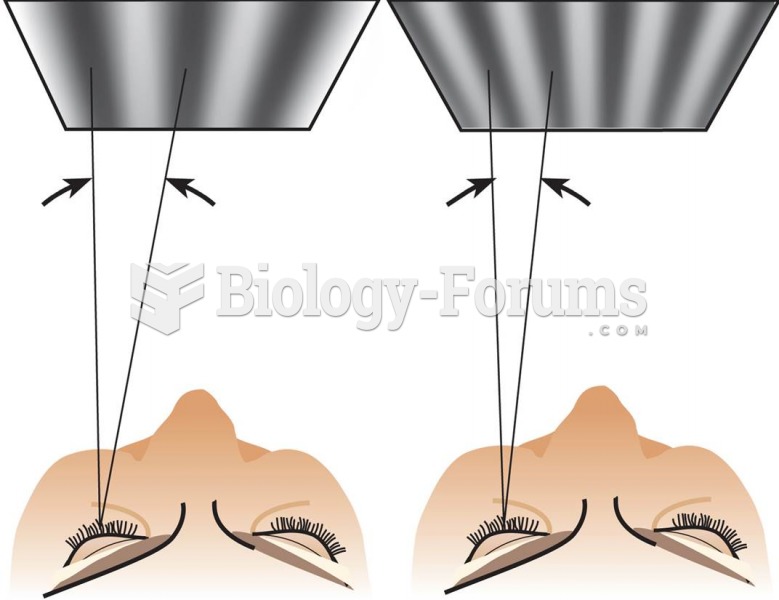 Visual Angle and Spatial Frequency
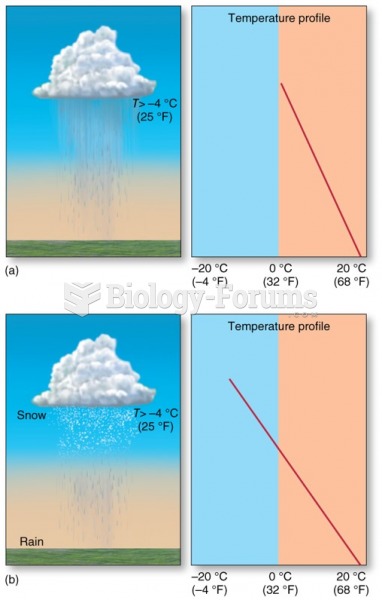 Distribution and Forms of Precipitation: Rain
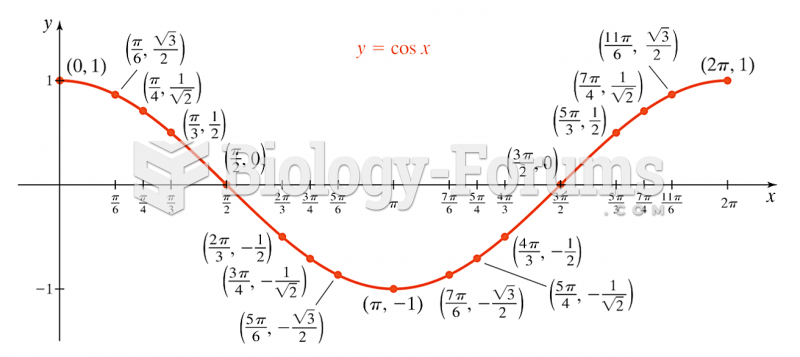 Graph of cos(x)
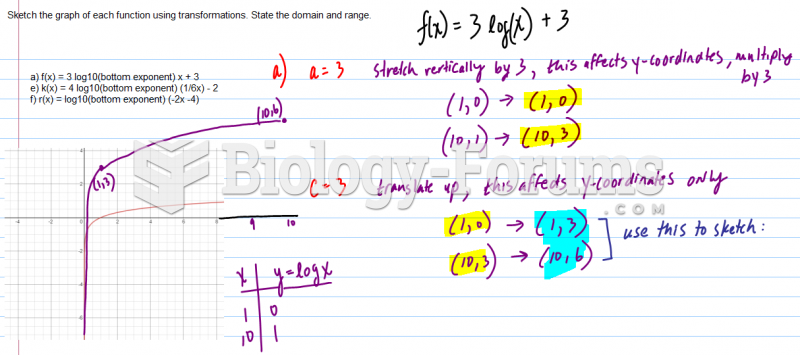 Sketch the graph of each function using transformations. State the domain and range.
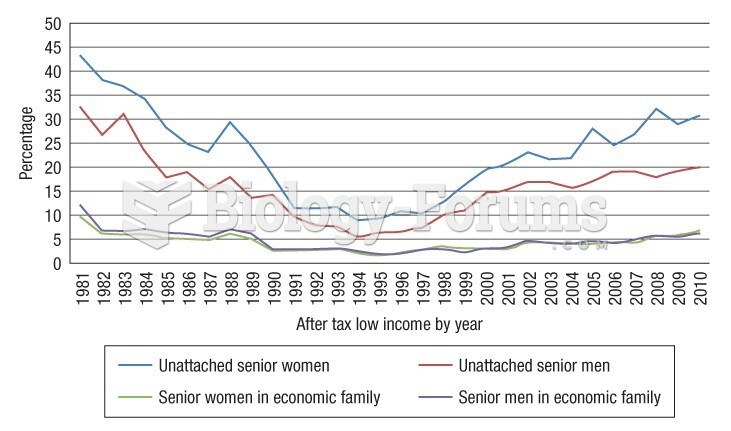 This graph illustrates how unattached older adults are poorer than their peers who live in families
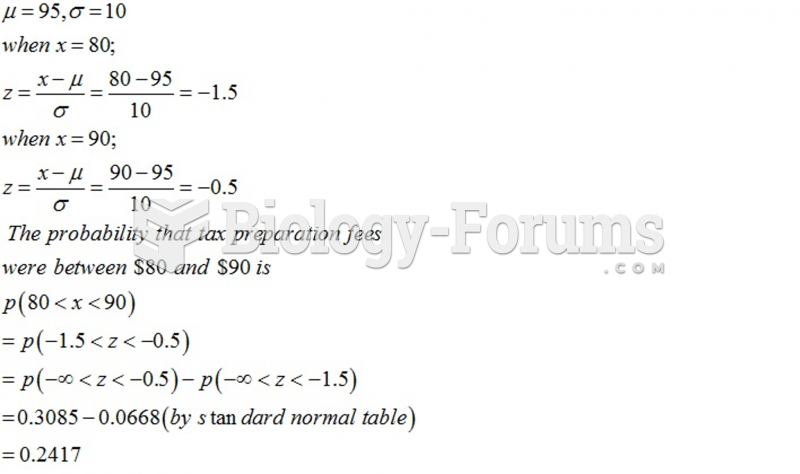 In 2000, the average charge of tax preparation was 95 . Assuming a normal distribution and a ...