This topic contains a solution. Click here to go to the answer
|
|
|

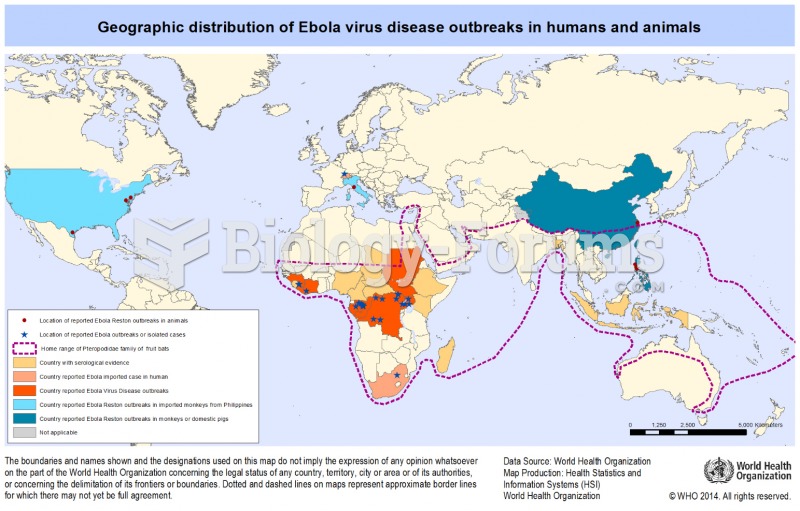 Ebola Virus Geographic Distribution
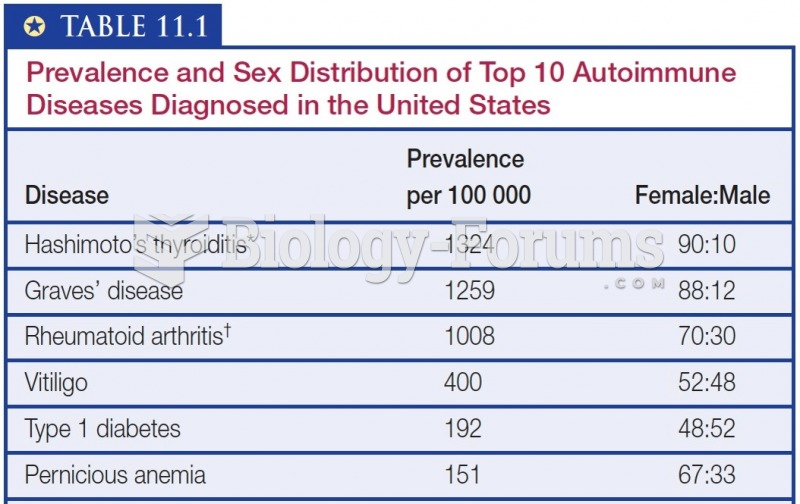 Prevalence and Sex Distribution of Top 10 Autoimmune Diseases Diagnosed in the United States
 Child's right hand and wrist displaying the characteristic spotted rash of Rocky Mountain ...
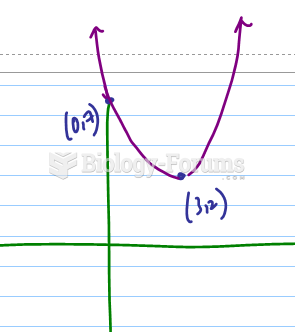 If a graph has the following x-intercepts, which value of x is the instantaneous rate of change ...
 The effect of selection on allele frequency
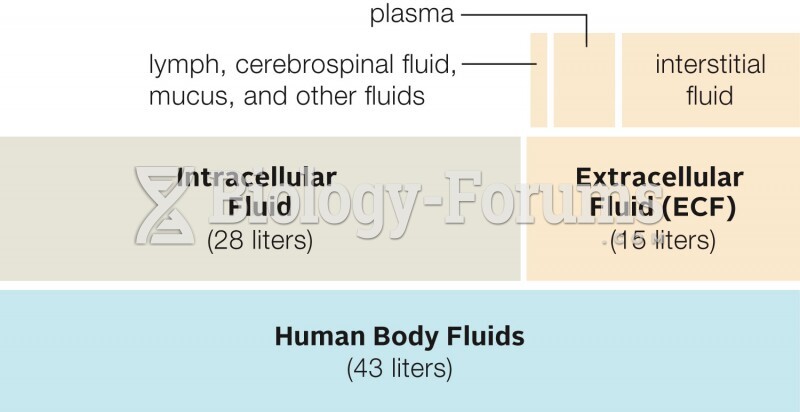 Distribution of Fluids in a Human Body