This topic contains a solution. Click here to go to the answer
|
|
|

 The phosphorus cycle. Numbers are 1012 g P or fluxes as 1012 g P per year (data from Schlesinger 199
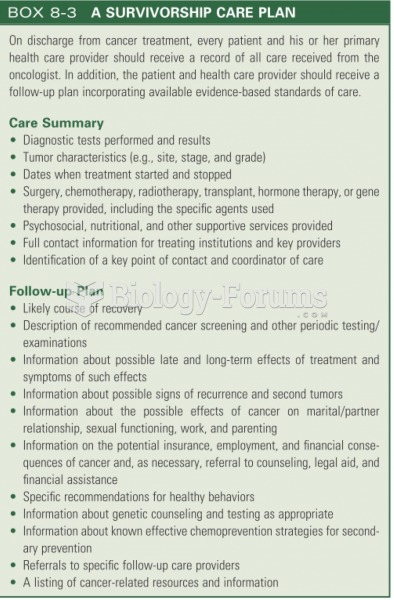
 Critical thinking involves analysis in which the nurse examines patient data available from a variet
 Summary of US Census Data
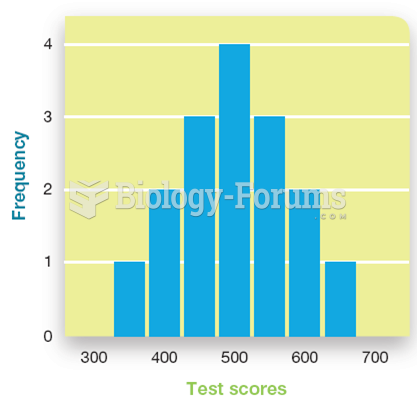 Graphing Psychological Data
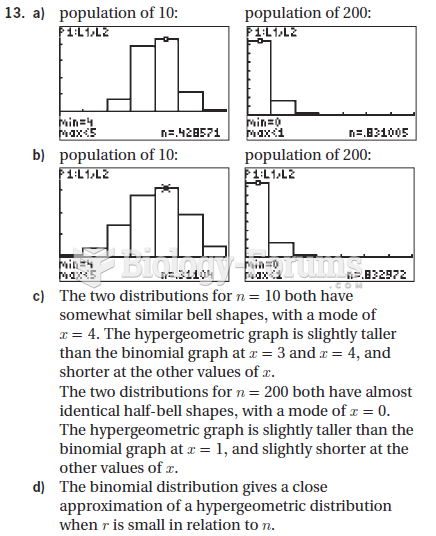 Data management short answer q
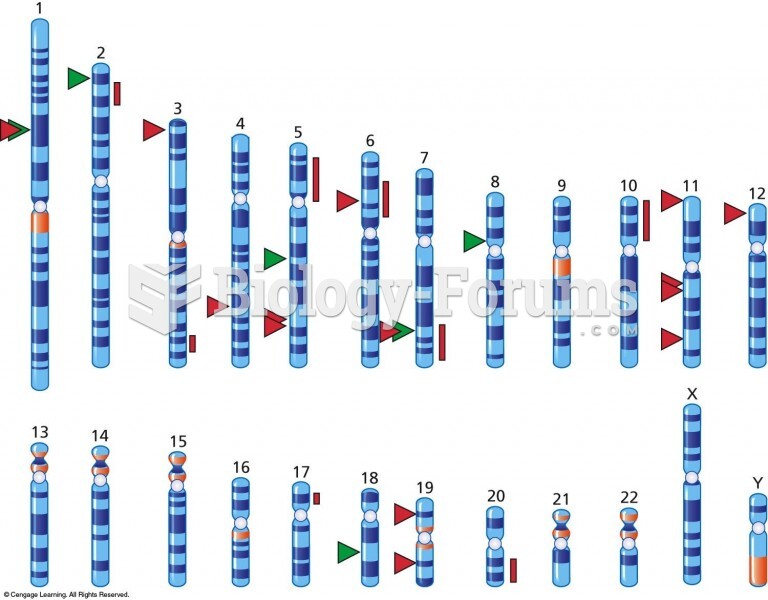 Some obesity genes in the human genome. The green triangles represent single genes in which obesity