Answer to Question 1
When we estimate by means of simple linear regression, we want to accurately predict one variable with another variable. As noted, however, both explained variation (SSR) and unexplained variation (SSE) will exist. That the points do not fall directly on the line is due to the unexplained variation other factors affecting the model. The Least Squares Method minimizes this unexplained amount of variability. If a large amount of variability is explained, the coefficient of determination will be closer to 1 and the line will give us good estimates and predictors. The only way all the points will fall on a straight line, is if nothing affects the Y variable except the X variable and they have a perfect correlation or +1 or -1. However, the closer the points are clustered about a line, the better the fit of the line and the more the Y variable variation is explained by the X variable.
Answer to Question 2
A

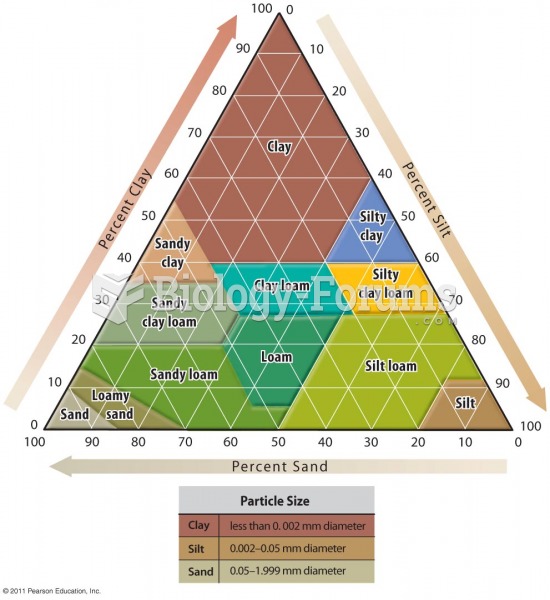 Soil Texture Diagram
 Othmer’s Equilibrium Still Schematic Diagram
 Design Data for Various Packings
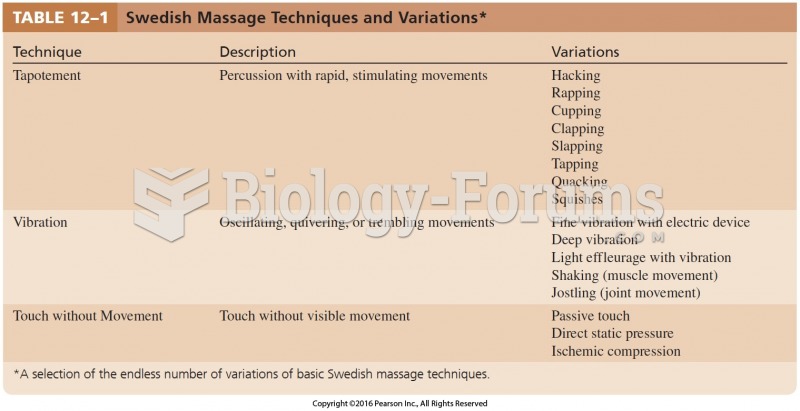 Swedish Massage Techniques and Variations Cont.
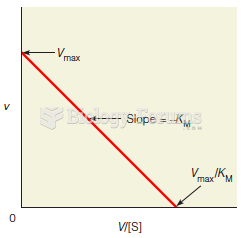 An Eadie–Hofstee plot
 Raman has a line of credit loan with the ICICI bank. The initial loan balance was $72000.00. ...