This topic contains a solution. Click here to go to the answer
|
|
|

 Sitting versus walking
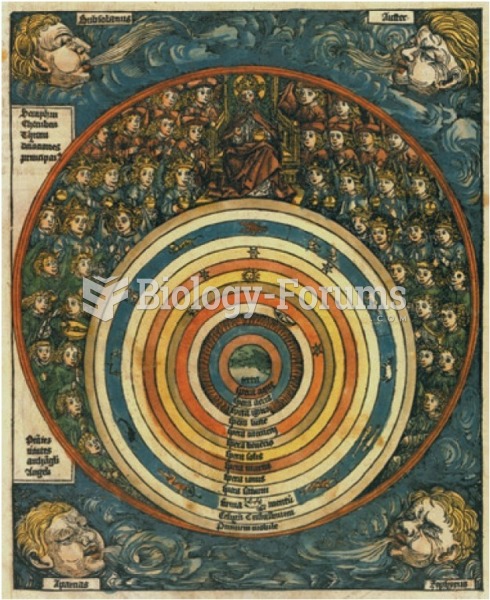 Science versus religion: What accounts for the conflict and tension that have existed between them?
 Schematic representations of (a) linear, (b) branched, (c) crosslinked, and (d) network (three-dimen
 Simple amplification of 1kb DNA fragments by polymerase chain reaction.
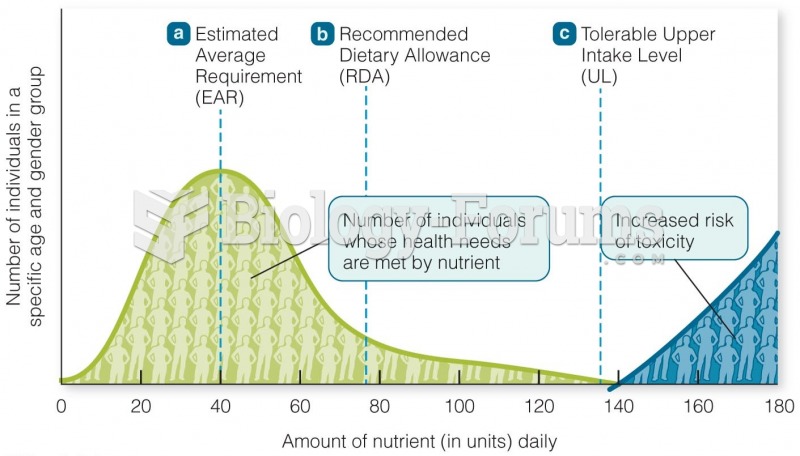 The Dietary Reference Intakes Are Reference Values for Each Nutrient
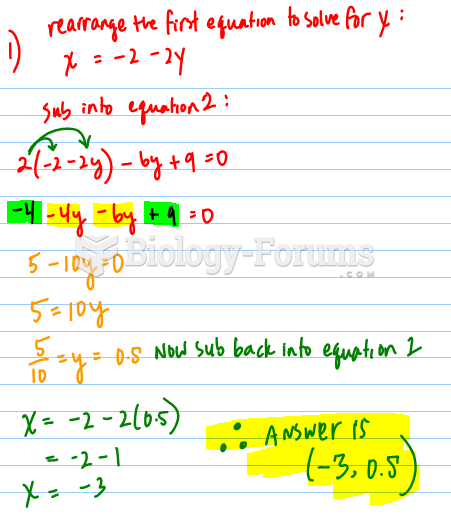 Substitution, Linear Systems