This topic contains a solution. Click here to go to the answer
|
|
|

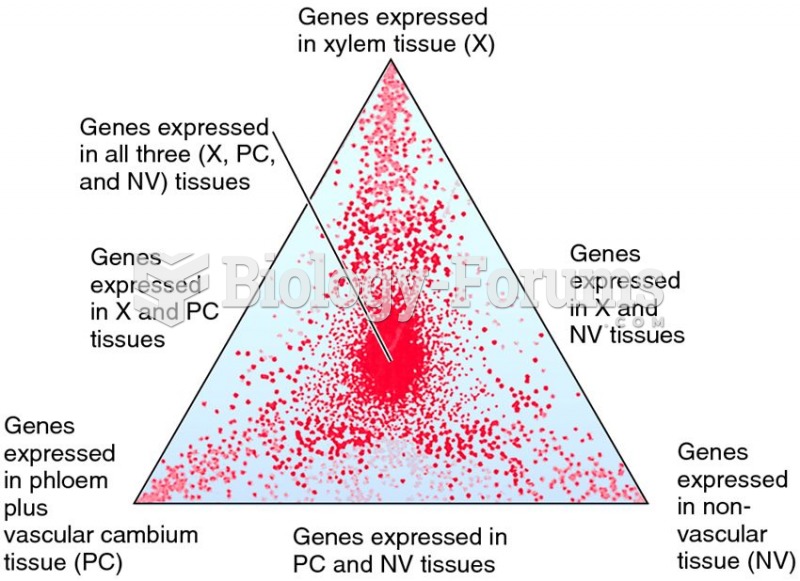 Triangle plot showing gene expression related to xylem, phloem, and nonvascular tissue in Arabidopsi
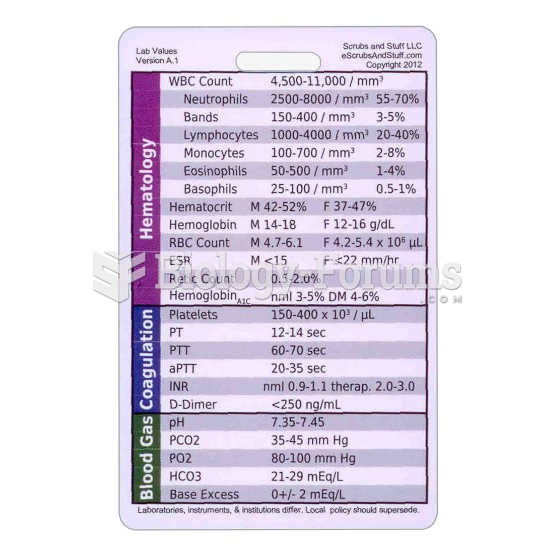 Lab values
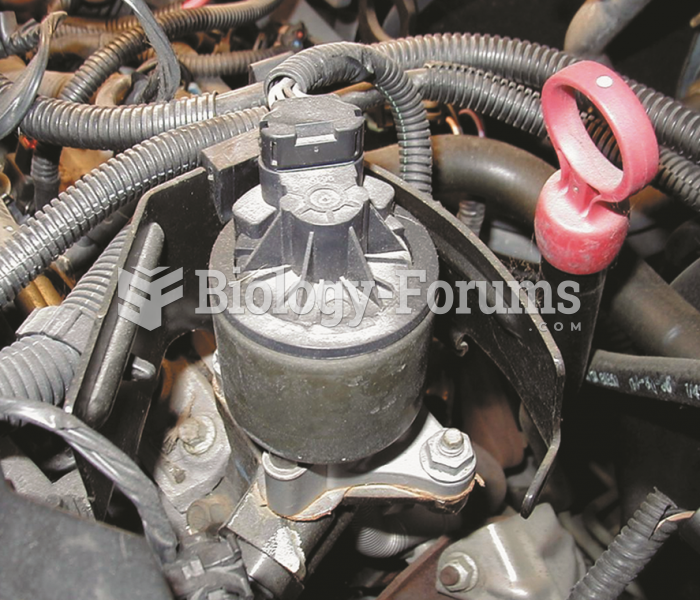 A General Motors linear EGR Valve.
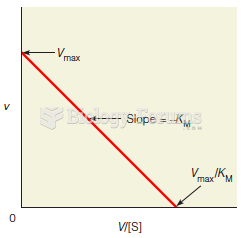 An Eadie–Hofstee plot
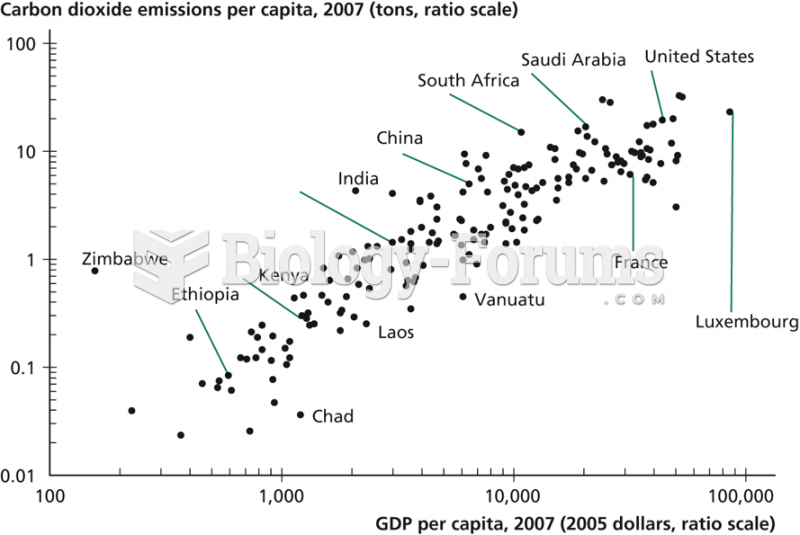 GDP per Capita versus Carbon Dioxide Emissions per Capita
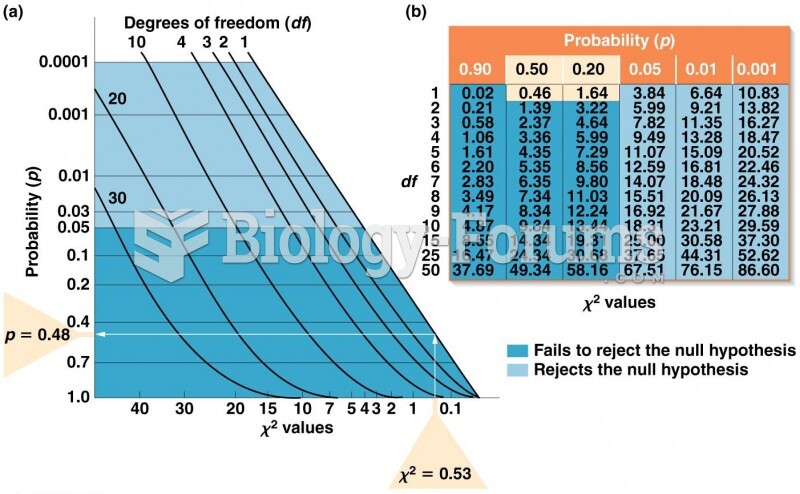 (a) Graph for converting values to p values. (b) Table of values for selected values of df