|
|
|

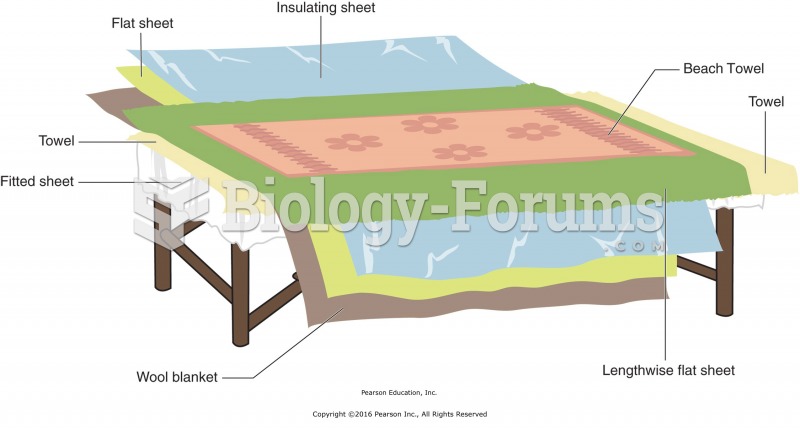 Layers of sheets and towels on the table for a body wrap.
 How to create a table of values from an equation and graph
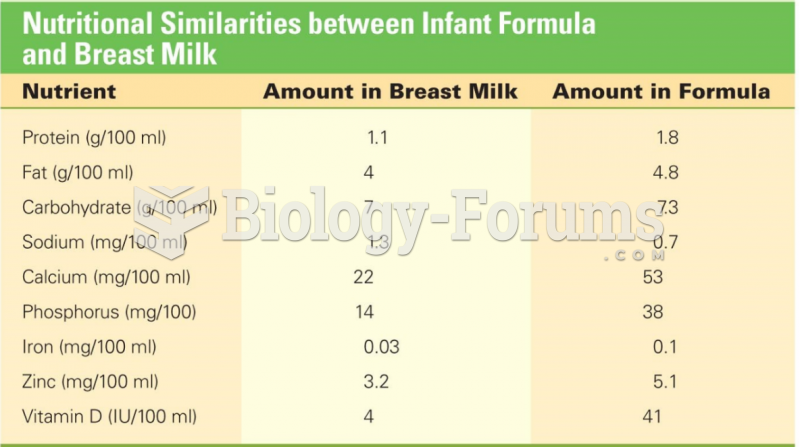 Nutritional Similarities between Infant Formula and Breast Milk
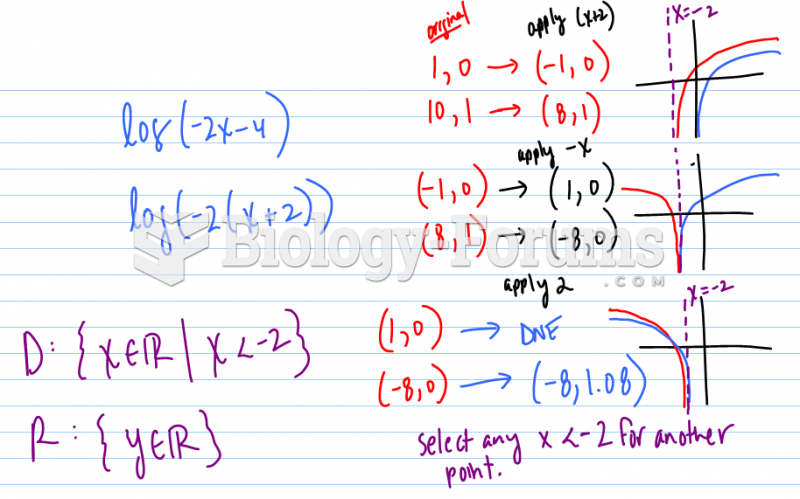 Sketch the graph of each function using transformations. State the domain and range.
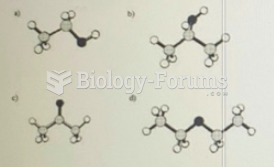 Ethanol has the molecular formula C2H6O. Which ball and stick model shown above represents ...
 Future Value Formula