This topic contains a solution. Click here to go to the answer
|
|
|

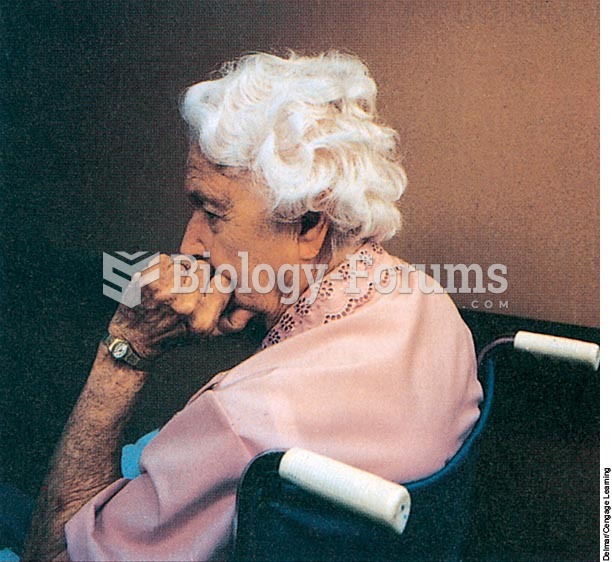 Older adults may grieve intensely over the loss of a person or situation that has been a part of the
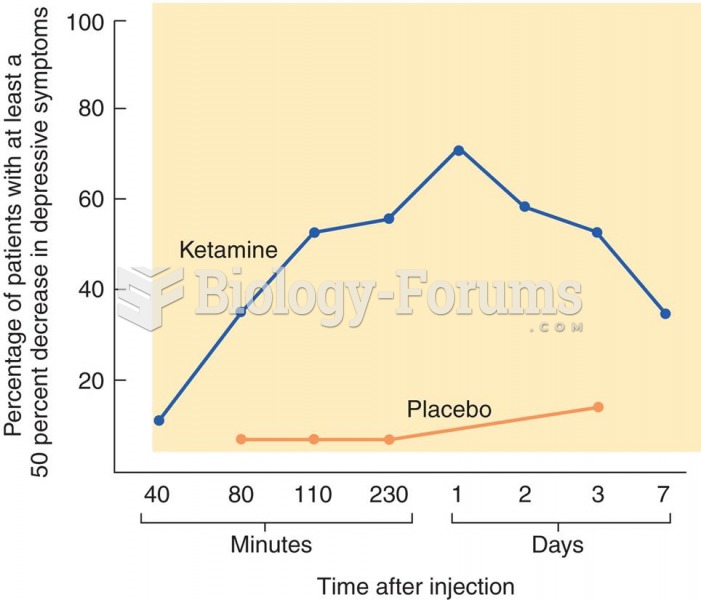 Treatment of Depression with Ketamine The graph shows the effects of ketamine on symptoms of depress
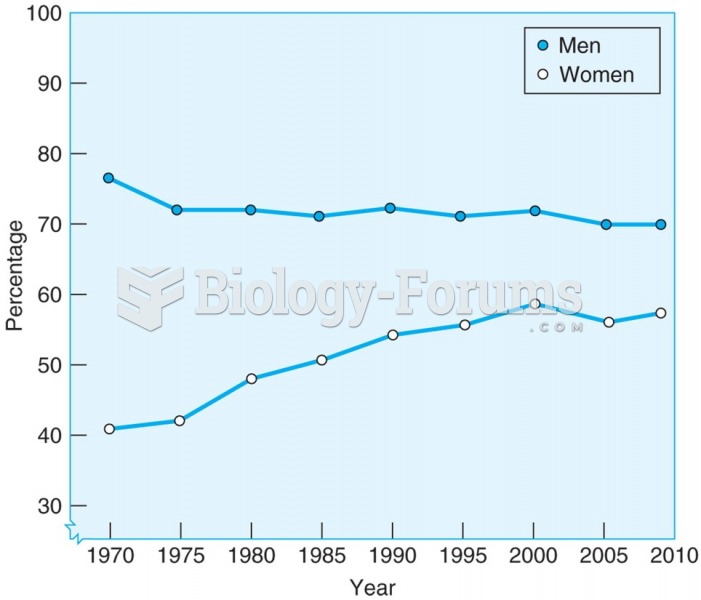 A greater number of men than women hold full-time jobs, but the gap is closing because of an ...
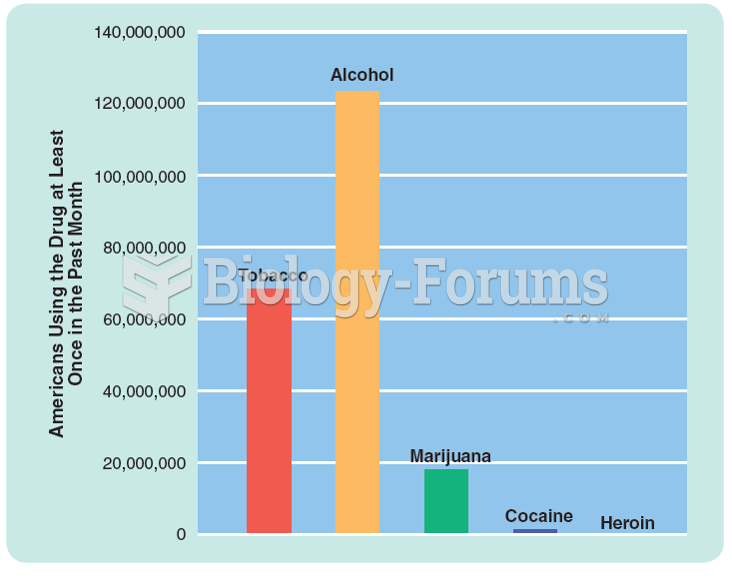 Prevalence of drug use in the United States. Figures are based on a survey of people 12 years of age ...
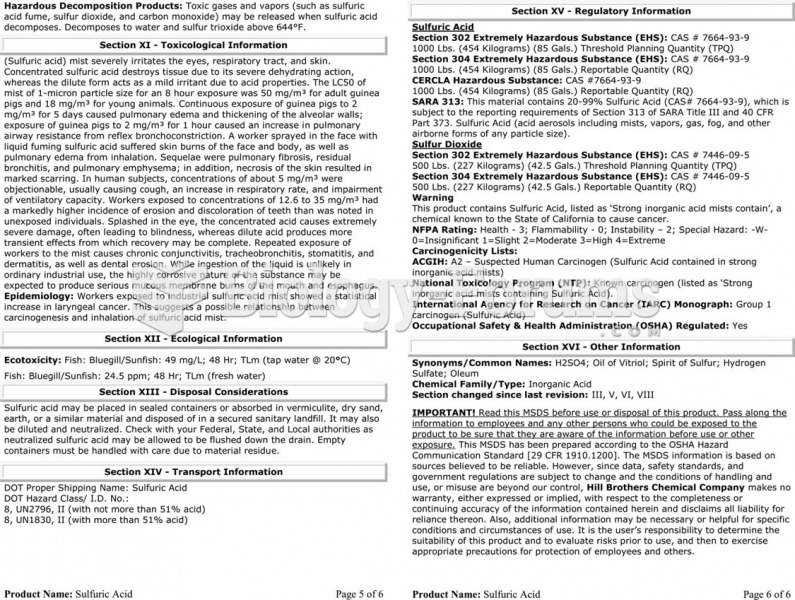 The material safety data sheet (MSDS) for sulfuric acid showing the detailed technical information ...
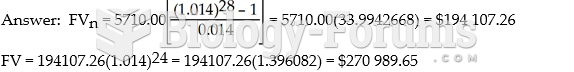 A man put aside $5710.00 at the end of every 3 months for seven years. How much will he have ...