This topic contains a solution. Click here to go to the answer
|
|
|

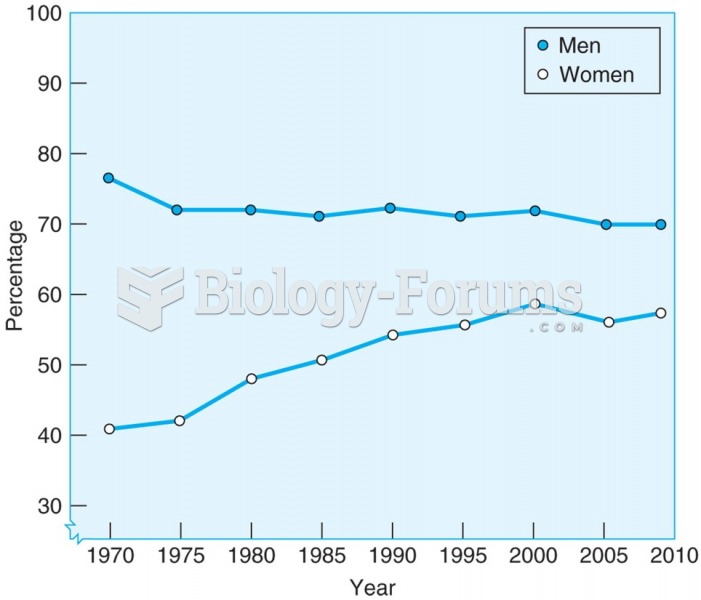 A greater number of men than women hold full-time jobs, but the gap is closing because of an ...
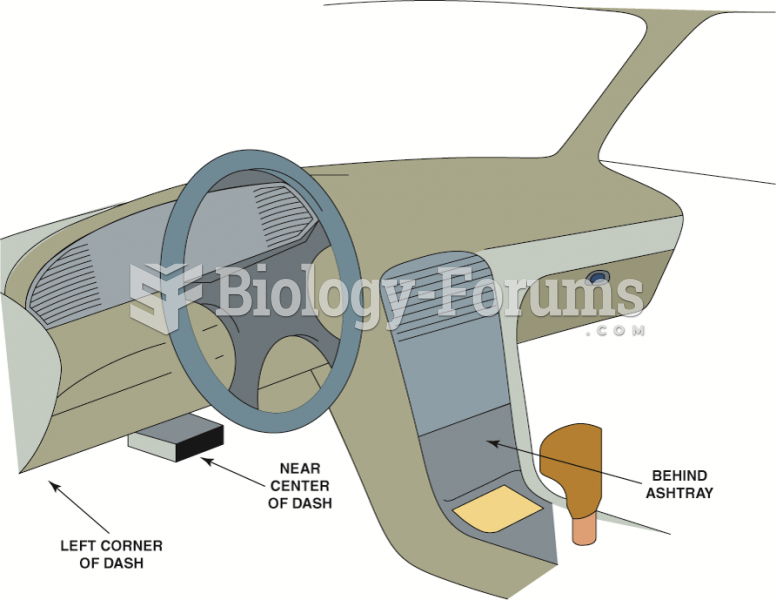 The data link connector (DLC) can be located in various locations.
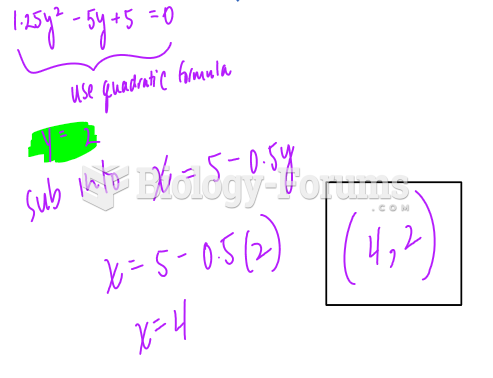 Intersection of Circles
 data
data
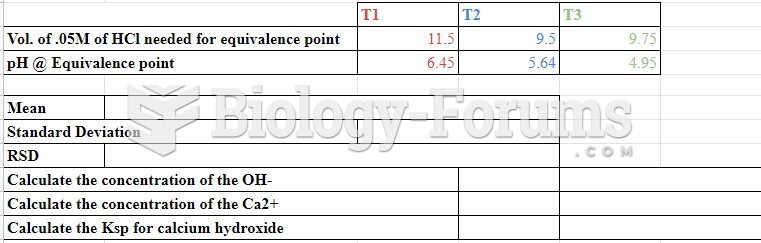
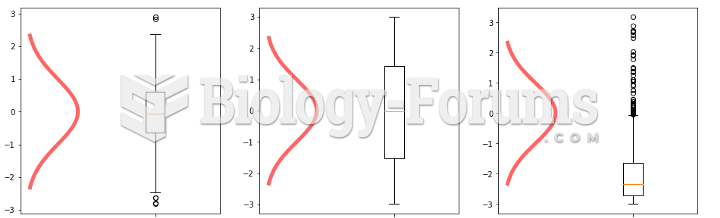 Histograms - Analysis and Data
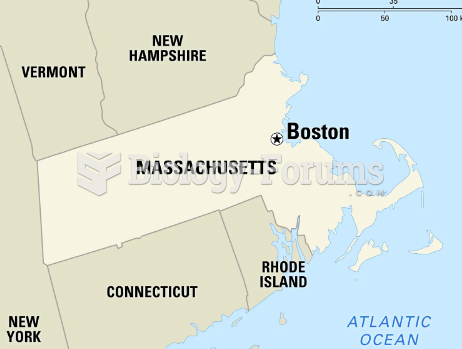 Locate the following places by reference number on the map:Key Locales of Political, Economic, ...