This topic contains a solution. Click here to go to the answer
|
|
|

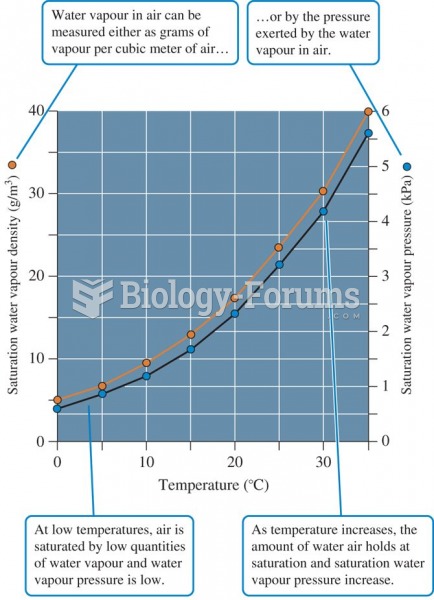 The relationship between air temperature and two measures of water vapour saturation of air.
 Technique of Indirect Percussion; Percussion Strike
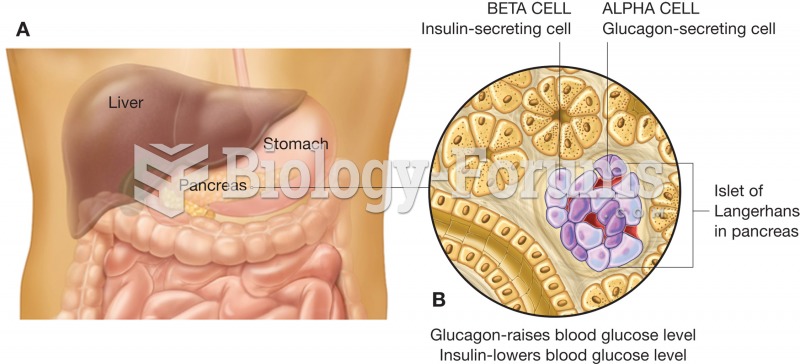 The pancreas. This organ sits just below the stomach and is both an exocrine and an endocrine gland.
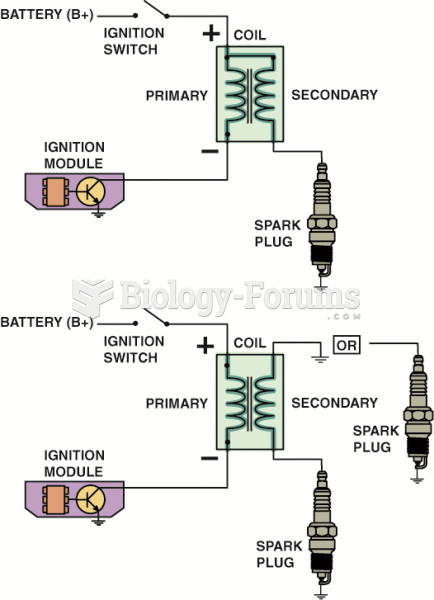 Some ignition coils are electrically connected, called married (top figure), whereas others use ...
 Discrete random variables- Probability Distribution Function
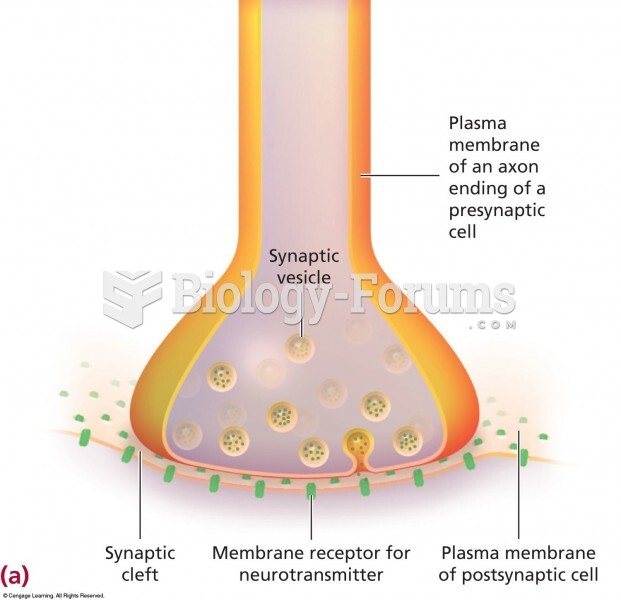 A thin cleft, called the synapse, separates one cell from another.