Did you know?
Certain chemicals, after ingestion, can be converted by the body into cyanide. Most of these chemicals have been removed from the market, but some old nail polish remover, solvents, and plastics manufacturing solutions can contain these substances.
Did you know?
Astigmatism is the most common vision problem. It may accompany nearsightedness or farsightedness. It is usually caused by an irregularly shaped cornea, but sometimes it is the result of an irregularly shaped lens. Either type can be corrected by eyeglasses, contact lenses, or refractive surgery.
Did you know?
Looking at the sun may not only cause headache and distort your vision temporarily, but it can also cause permanent eye damage. Any exposure to sunlight adds to the cumulative effects of ultraviolet (UV) radiation on your eyes. UV exposure has been linked to eye disorders such as macular degeneration, solar retinitis, and corneal dystrophies.
Did you know?
When Gabriel Fahrenheit invented the first mercury thermometer, he called "zero degrees" the lowest temperature he was able to attain with a mixture of ice and salt. For the upper point of his scale, he used 96°, which he measured as normal human body temperature (we know it to be 98.6° today because of more accurate thermometers).
Did you know?
GI conditions that will keep you out of the U.S. armed services include ulcers, varices, fistulas, esophagitis, gastritis, congenital abnormalities, inflammatory bowel disease, enteritis, colitis, proctitis, duodenal diverticula, malabsorption syndromes, hepatitis, cirrhosis, cysts, abscesses, pancreatitis, polyps, certain hemorrhoids, splenomegaly, hernias, recent abdominal surgery, GI bypass or stomach stapling, and artificial GI openings.

 Relationship between winter rainfall and chuckwalla, Sauromalus, size
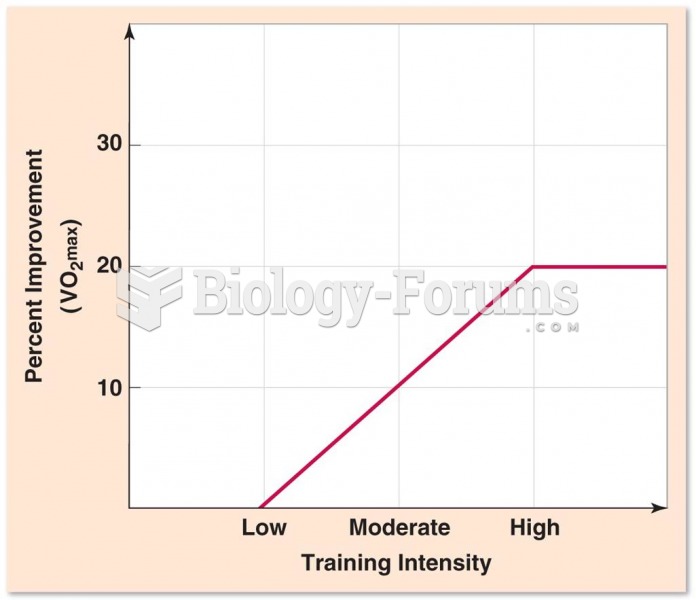 Relationship Between Training Intensity and VO2max Improvement
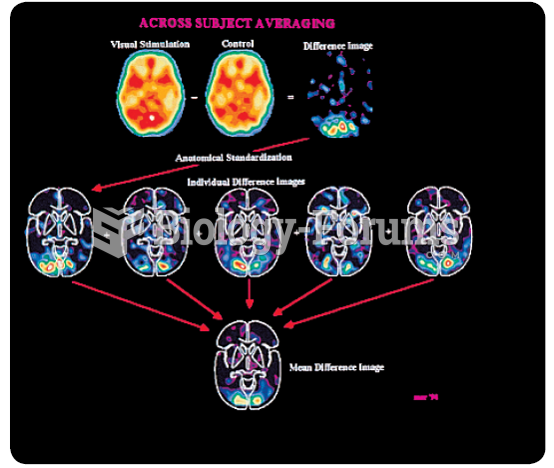 The paired-image subtraction technique, which is commonly employed in cognitive neuroscience. Here ...
 MICHEL LORBLANCHET SIMULATING THE TECHNIQUE OF PREHISTORIC CAVE PAINTERS
 Relationship between Income Inequality and the Desired Tax Rate
 Discrete random variables- Probability Distribution Function