|
|
|

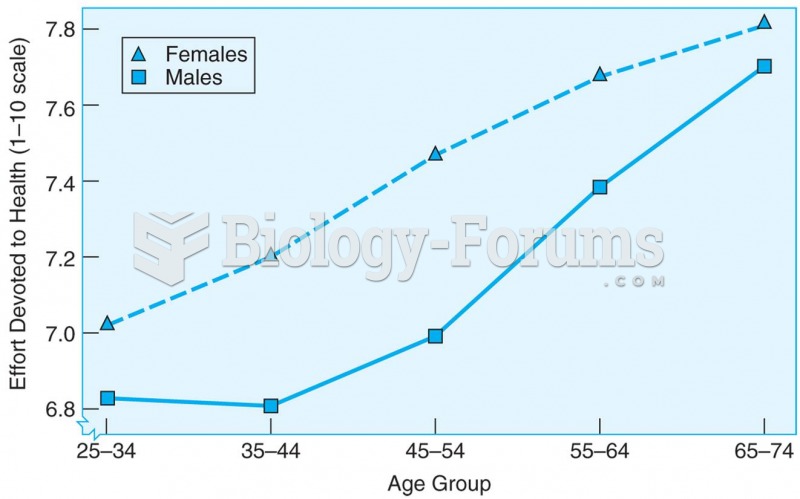 Cross-sectional data showing that the amount of effort spent on personal health care increases with
 How do men who work in traditionally feminine nurturng jobs and women who work in jobs that give ...
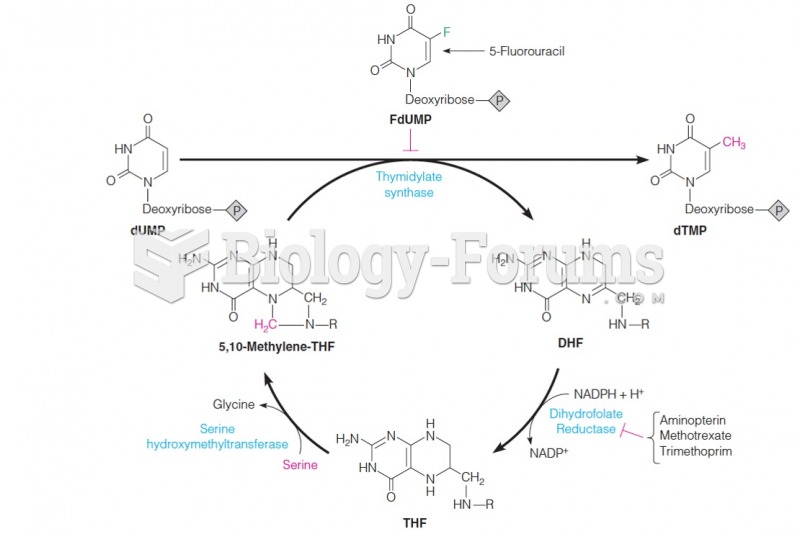 Relationship between thymidylate synthase and enzymes of tetrahydrofolate metabolism
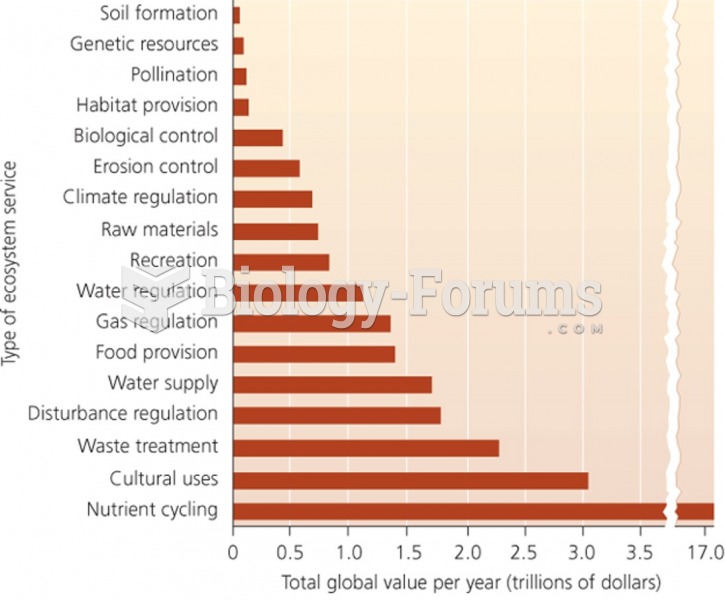 Types of ecosystem service vs. total global value per year
 Transmission genetics began with the study of pea plants.
 Number line (real numbers)