|
|
|

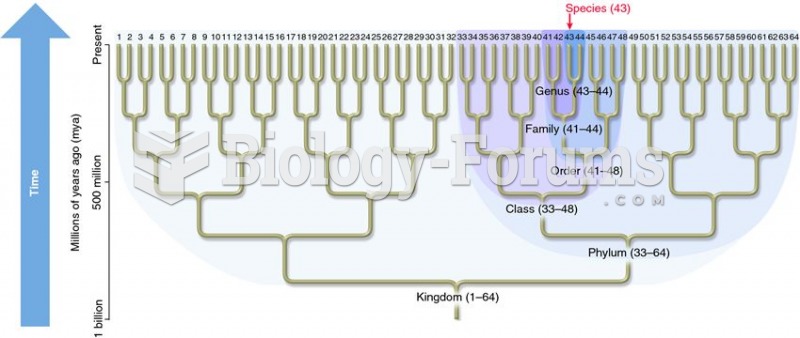 Schematic relationship between a phylogenetic tree and taxonomy.
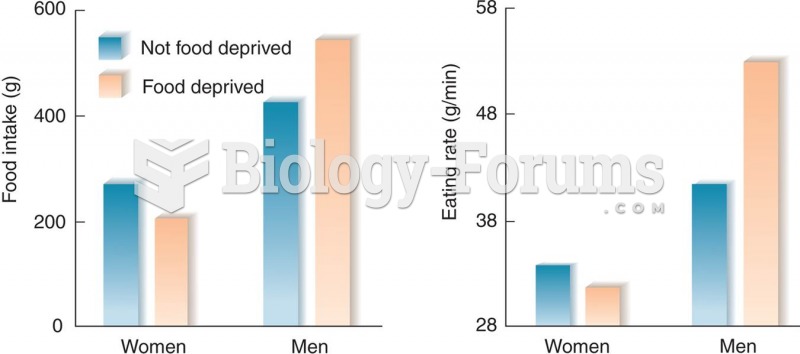 Reactions of Young Men and Women on Fasting
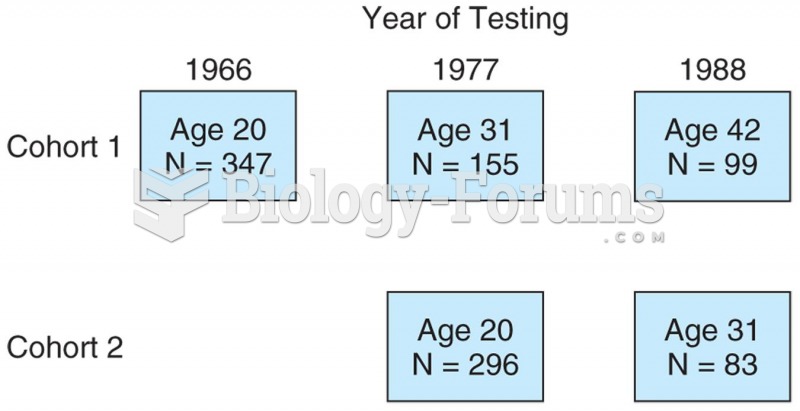 Model of a sequential study in which two cohorts were followed beginning at age 20. One cohort was f
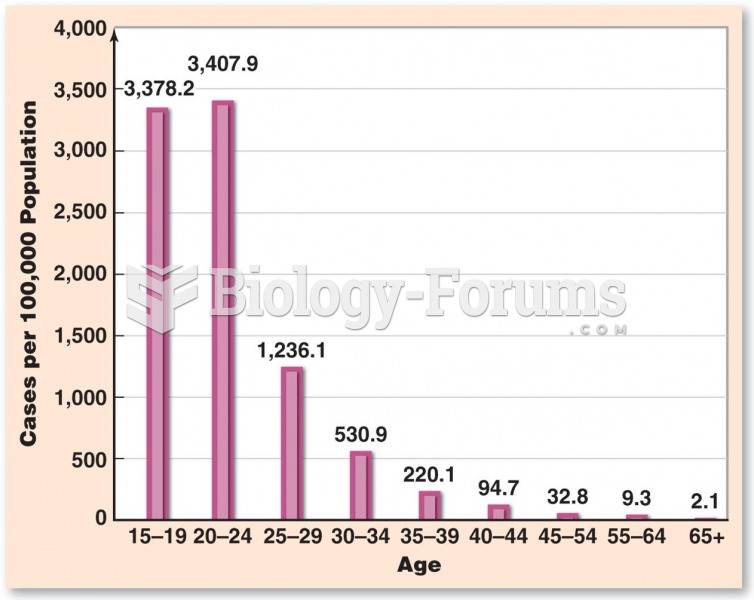 Chlamydia Rates in Women
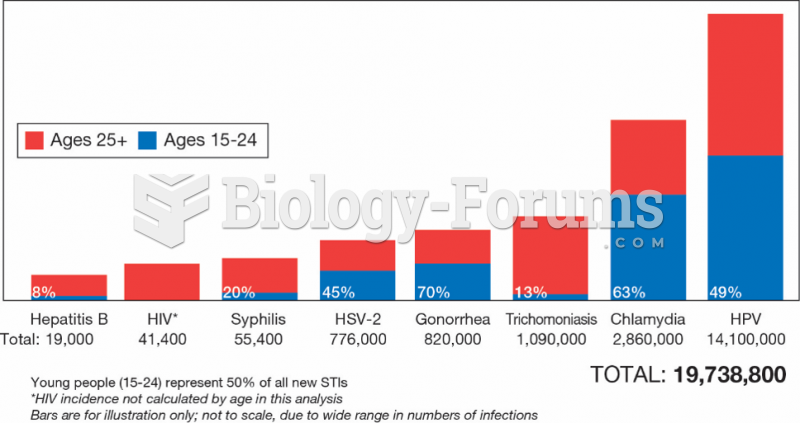 Estimated Number of New Sexually Transmitted Infections
 Priam Painter: Women at a Fountain House