This topic contains a solution. Click here to go to the answer
|
|
|

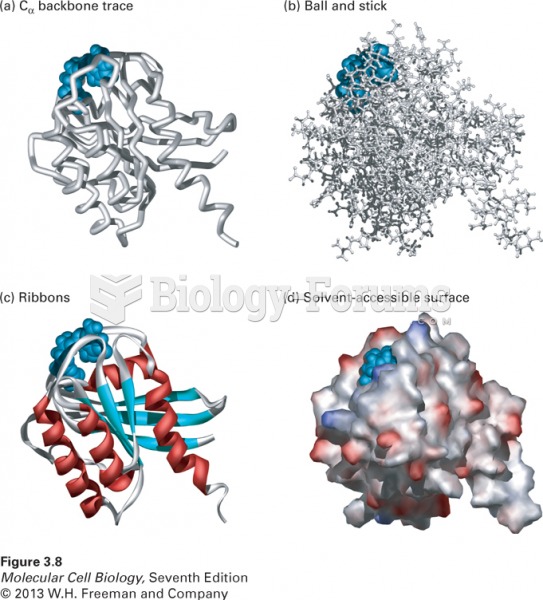 Four ways to visualize protein structure
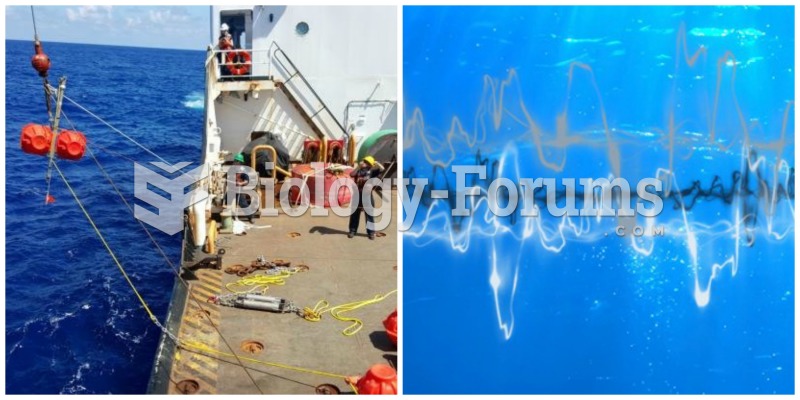 Ocean sounds
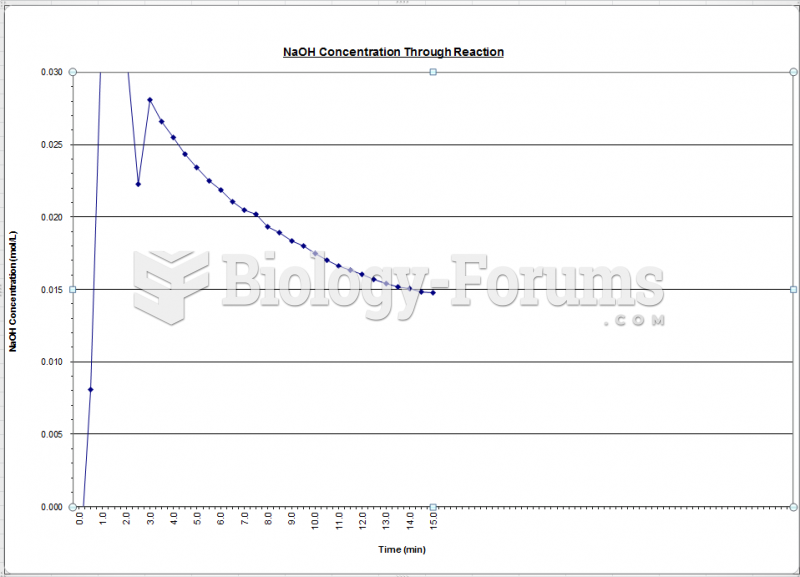 Fluidization - Concentration NaOH Chart
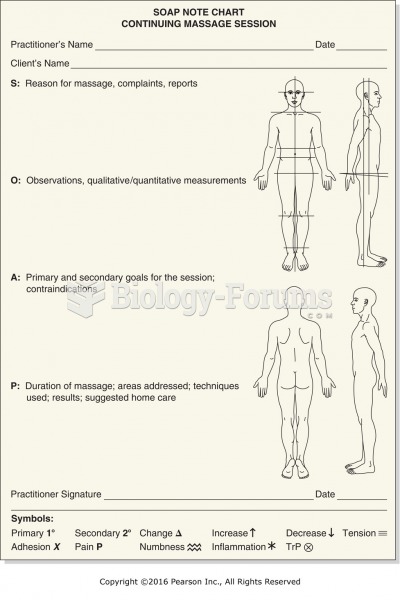 Example of SOAP chart with body diagram.
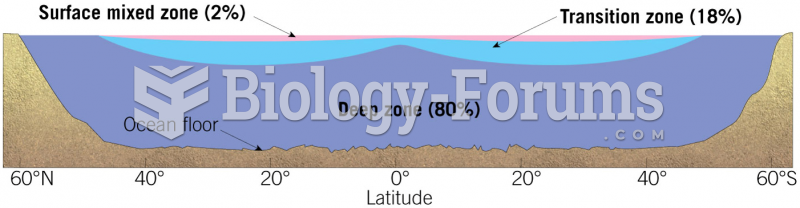 The Ocean’s Layers
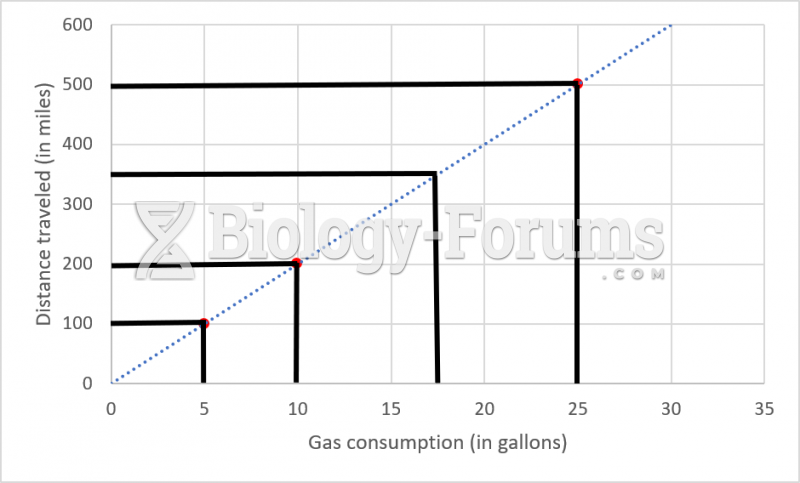 Proportionality chart