This topic contains a solution. Click here to go to the answer
|
|
|

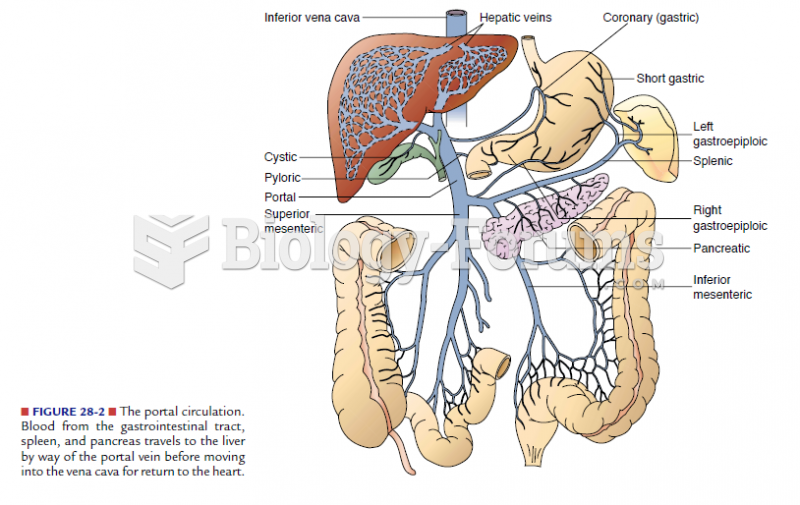 portal circulation
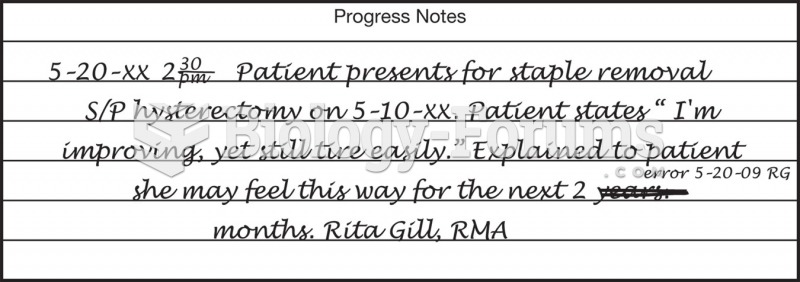 An example of a corrected chart notation.
 Testing Distance Visual Acuity Using a Snellen Eye Chart
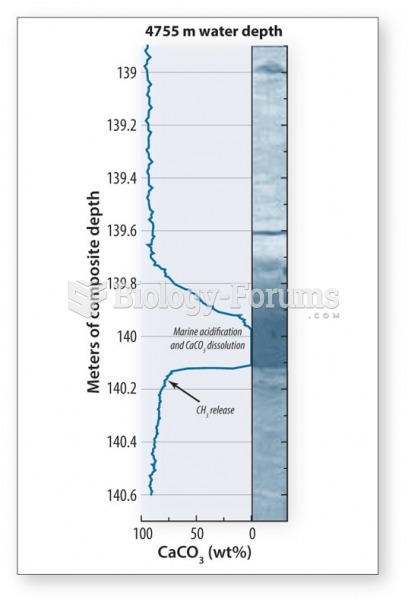 Ocean acidification (shells missing)
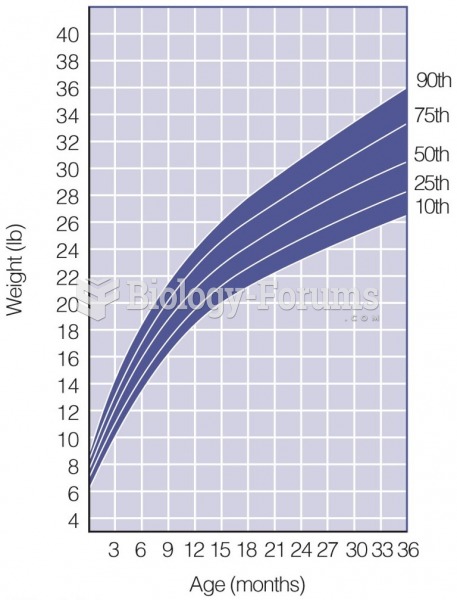 Growth Chart
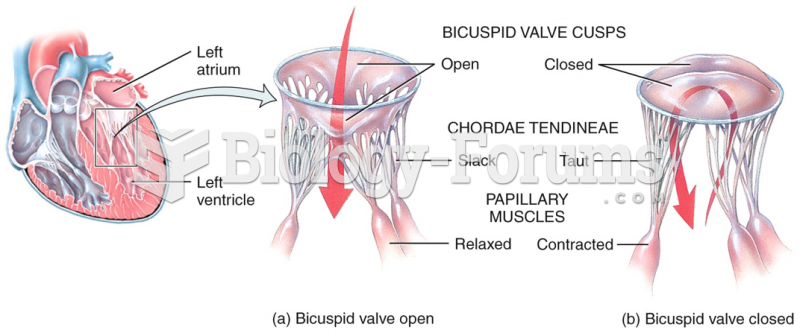 Heart Valves and Circulation of Blood