This topic contains a solution. Click here to go to the answer
|
|
|

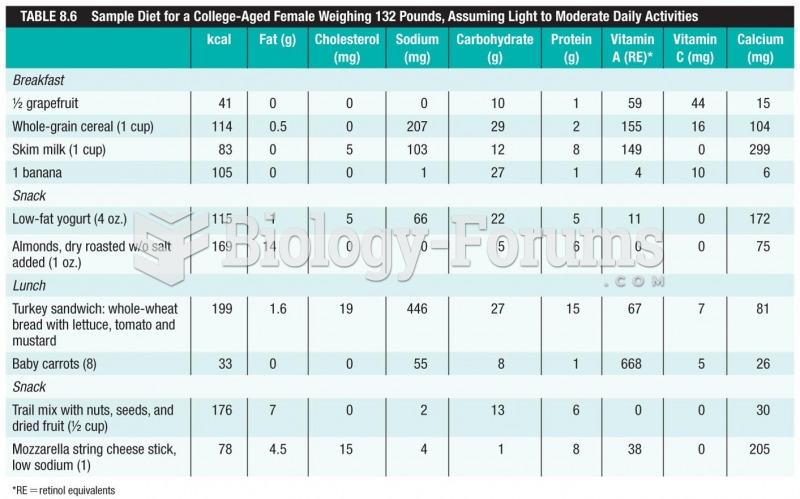 Sample Diet for a College-Aged Female Weighing 132 Pounds, Assuming Light to Moderate Daily ...
 Sample Exercise Program for Healthy Older Adults
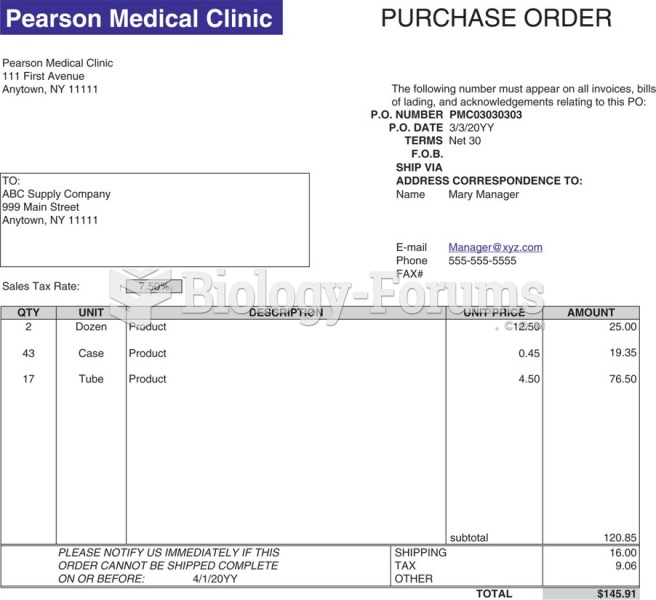 Sample purchase order form.
 Sample Medicare identification card.
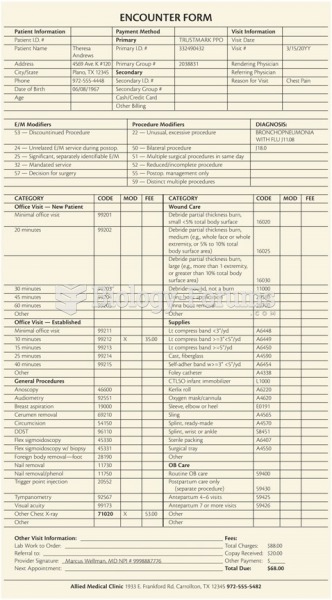 A sample encounter form.
 Velocity-time Graph