This topic contains a solution. Click here to go to the answer
|
|
|

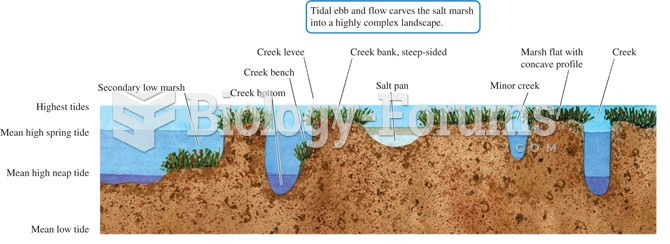 Salt marsh channels shown in cross section.
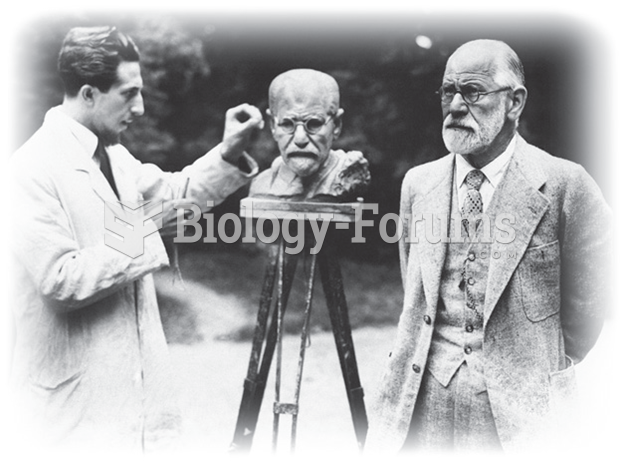 Shown here is Sigmund Freud in 1931 as he poses for a sculptor in Vienna, Austria. Although Freud ...
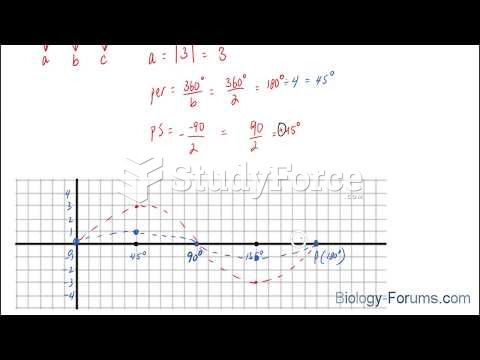 How to plot a sine function containing an amplitude and phase shift (Question 1 of 3)
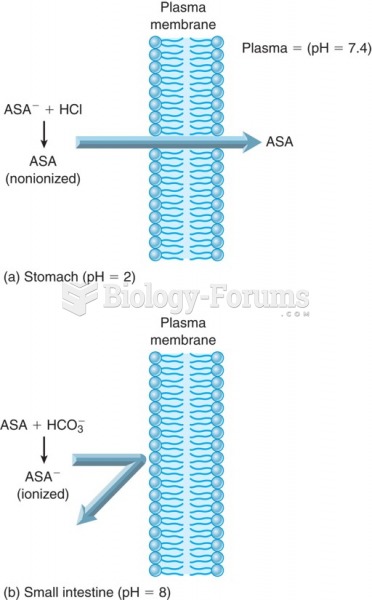 Effect of pH on drug absorption. (a) A weak acid such as aspirin (ASA) is in a nonionized form in an ...
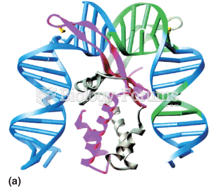 Integrative recombination in phage l: DNA bending by IHF, shown by X-ray crystallography
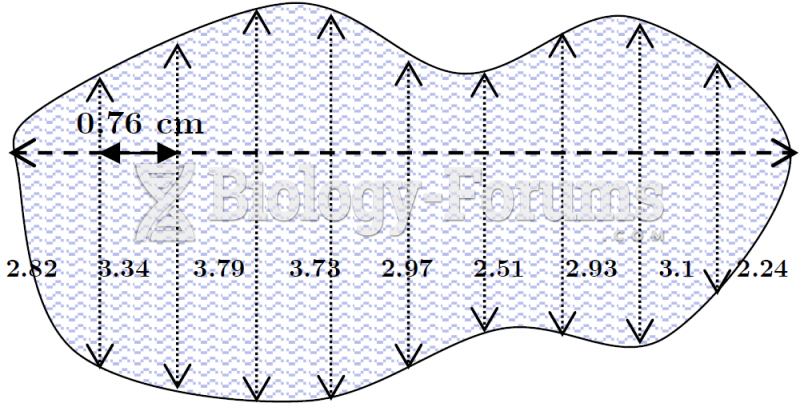 Offset Method Plot of Land with Measurements