Did you know?
There used to be a metric calendar, as well as metric clocks. The metric calendar, or "French Republican Calendar" divided the year into 12 months, but each month was divided into three 10-day weeks. Each day had 10 decimal hours. Each hour had 100 decimal minutes. Due to lack of popularity, the metric clocks and calendars were ended in 1795, three years after they had been first marketed.
Did you know?
When intravenous medications are involved in adverse drug events, their harmful effects may occur more rapidly, and be more severe than errors with oral medications. This is due to the direct administration into the bloodstream.
Did you know?
Tobacco depletes the body of vitamins A, C, and E, which can result in any of the following: dry hair, dry skin, dry eyes, poor growth, night blindness, abscesses, insomnia, fatigue, reproductive system problems, sinusitis, pneumonia, frequent respiratory problems, skin disorders, weight loss, rickets, osteomalacia, nervousness, muscle spasms, leg cramps, extremity numbness, bone malformations, decayed teeth, difficulty in walking, irritability, restlessness, profuse sweating, increased uric acid (gout), joint damage, damaged red blood cells, destruction of nerves, infertility, miscarriage, and many types of cancer.

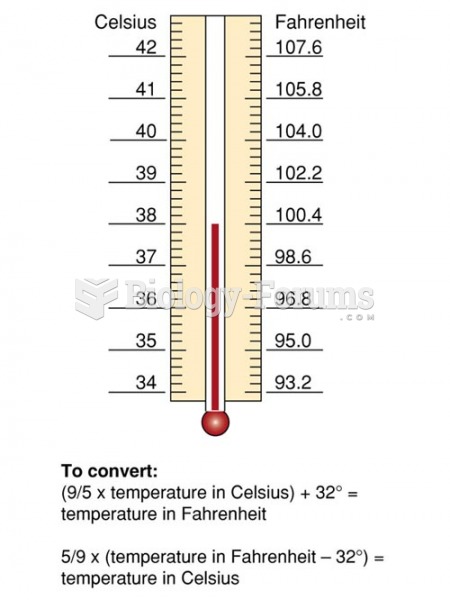 Correlation between Celsius and Fahrenheit Scales
 The positive correlation between the ability of various neuroleptics to bind to D2 receptors and ...
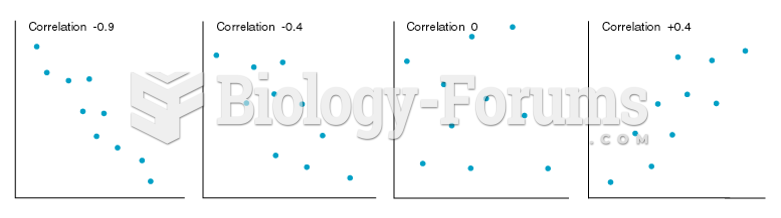 Scatterplots of Variables Having Several Different Levels of Correlation
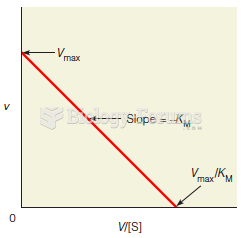 An Eadie–Hofstee plot
 How to determine if a table of values represents a function
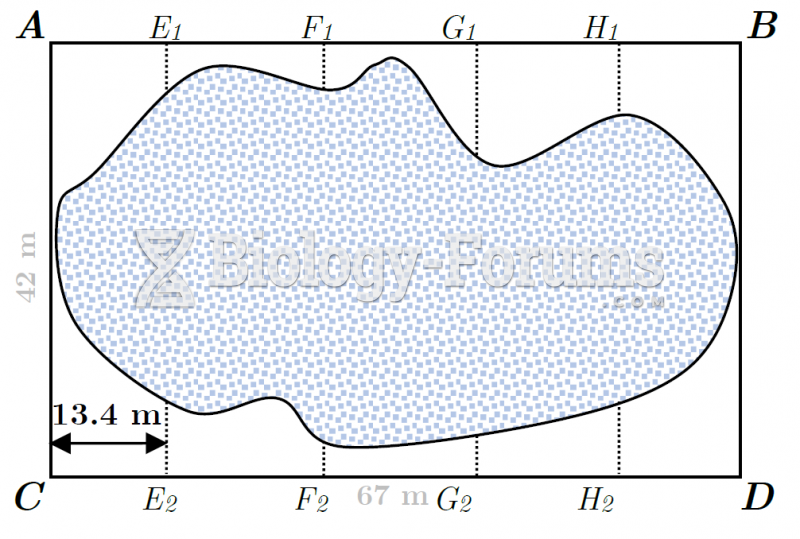 Plot of Land (Modified Offset Method) - Offset lines