|
|
|

 Richard Rodriguez represents millions of immigrants—not just those of Latino origin but those from ...
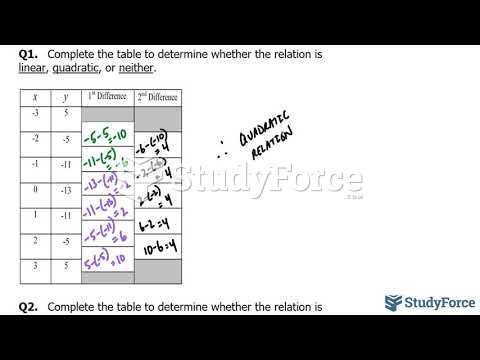 How to determine if a table of values represents a linear or quadratic relationship
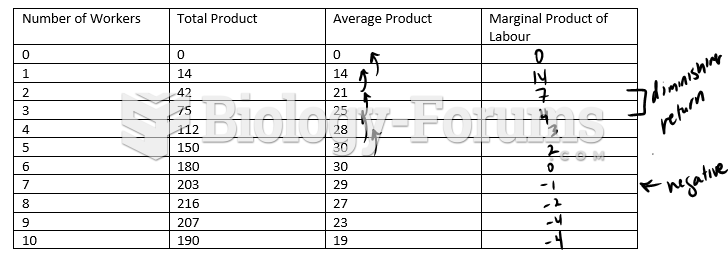 Complete the following production chart and plot the points.
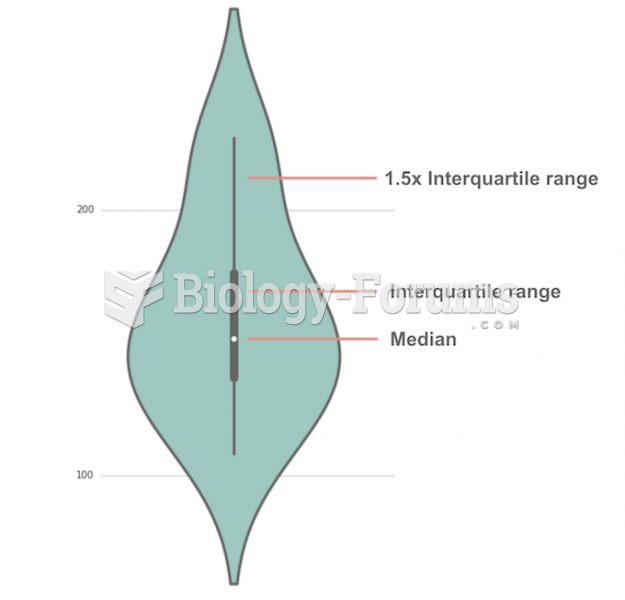 Violin Plot
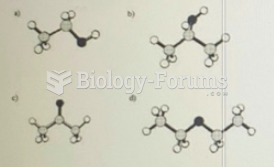 Ethanol has the molecular formula C2H6O. Which ball and stick model shown above represents ...
 Table - Correlation Analysis