|
|
|

 For millions of people, the United States represents a land of opportunity and freedom from ...
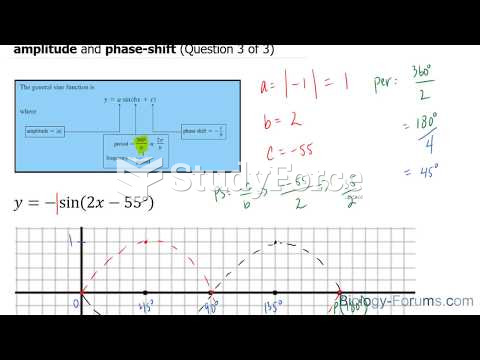 How to plot a sine function with a negative amplitude and phase shift (Question 3 of 3)
 How to plot a cosine function containing an amplitude and phase-shift (Question 2 of 2)
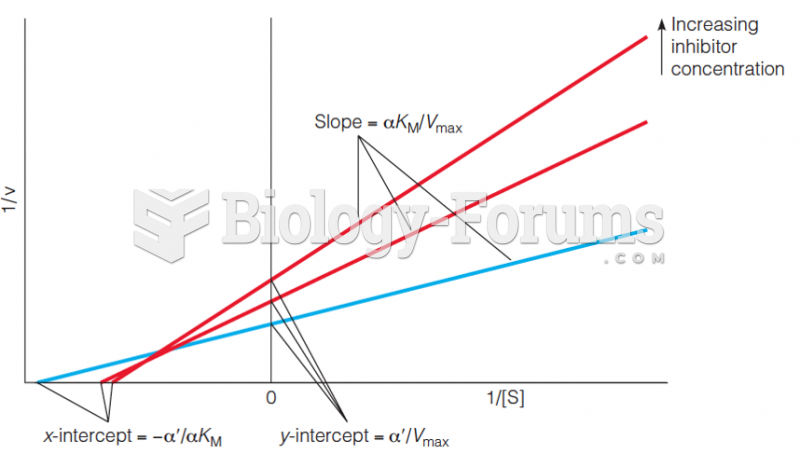 Lineweaver–Burk plot for mixed inhibition kinetics
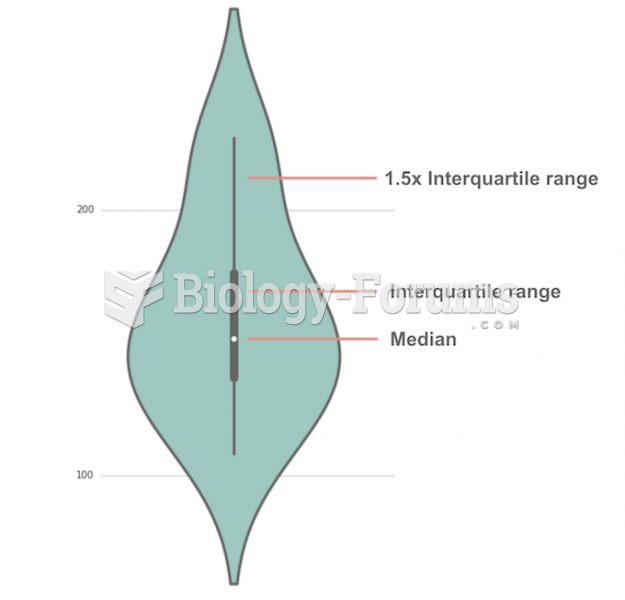 Violin Plot
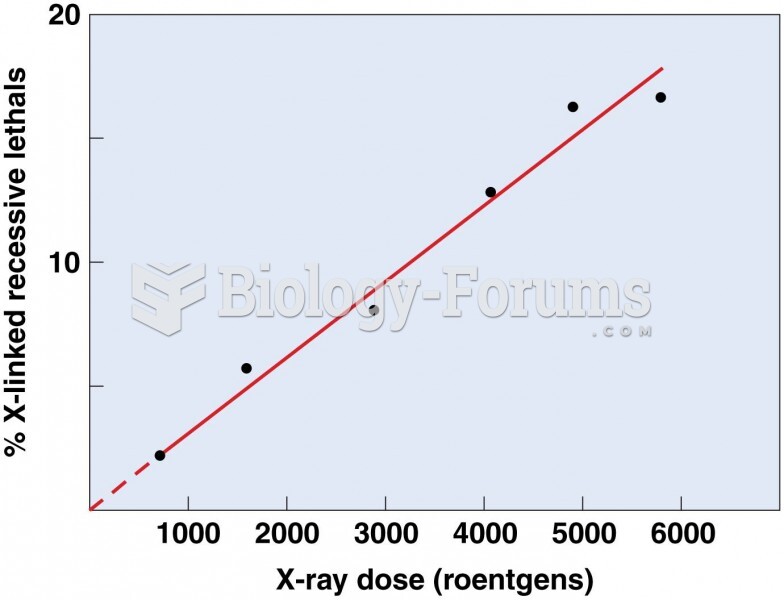 Plot of the percentage of X-linked recessive mutations