|
|
|

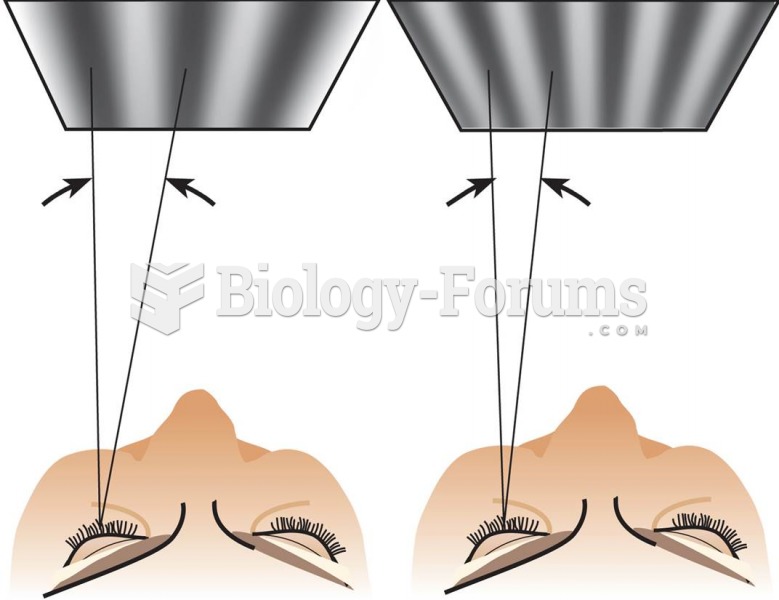 Visual Angle and Spatial Frequency
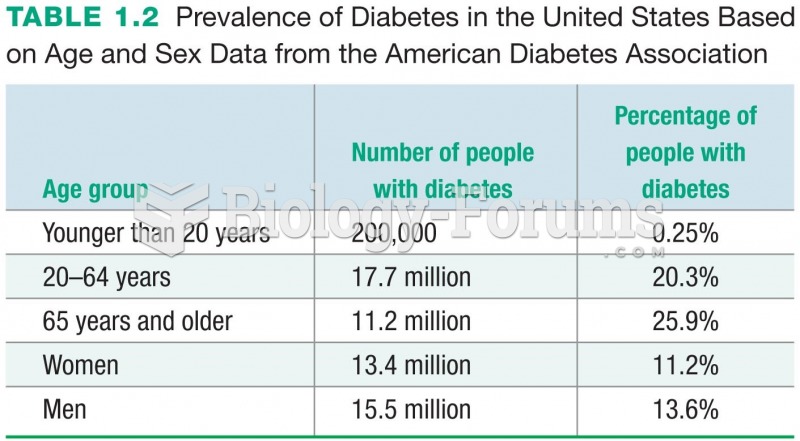 Prevalence of Diabetes in the United States Based on Age and Sex Data from the American Diabetes ...
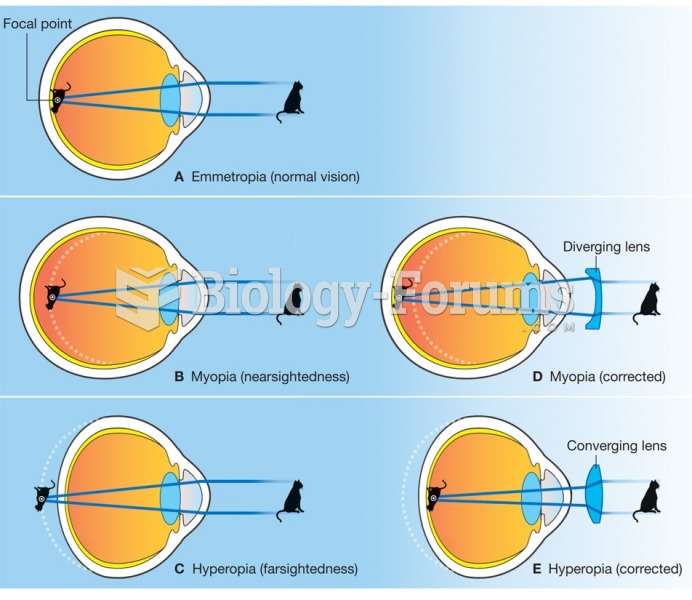 How lenses correct visual problems: (A) emmetropia; (B) myopia; (C) hyperopia; (D) corrected myopia; ...
 Distribution of Thunderstorms: Detailed data on cloud-to-ground lightning flashes have been ...
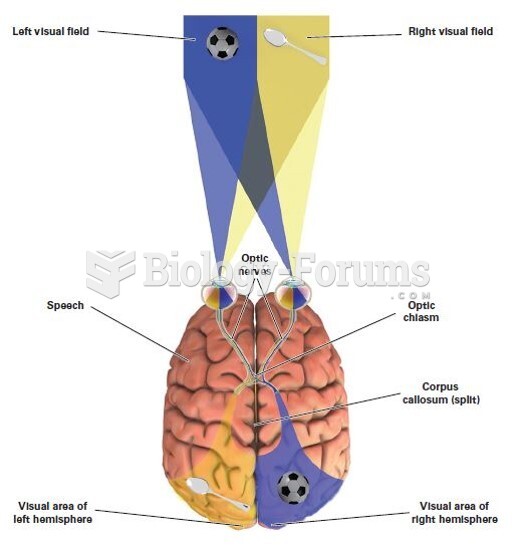 Right and Left Visual Fields
 Satellite data on primary productivity in the equatorial Pacific Ocean