This topic contains a solution. Click here to go to the answer
|
|
|

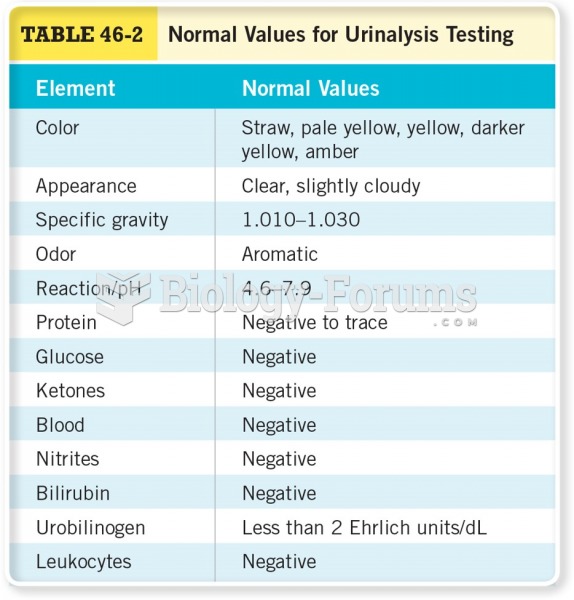 Normal Values for Urinalysis Testing
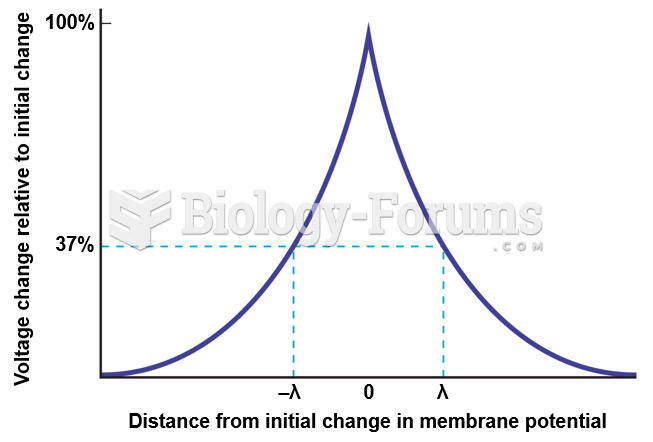 Distance from Initial Change in Membrane Potential vs. Voltage Change Relative to Initial Change
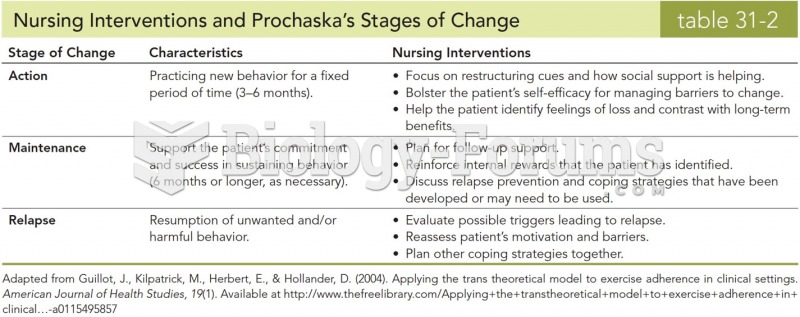 Nursing Interventions and Prochaska's Stages of Change
 Not only was the housing filled with nuts, but also this air filter was extremely dirty, indicating ...
 Demographic change and the effect on people social, and economic life
 Data for a Hypothetical Paternity Test Using 13 CODIS Genes