This topic contains a solution. Click here to go to the answer
|
|
|

 A color-enhanced scanning electron micrograph of a neuron cell body (grey) studded with terminal ...
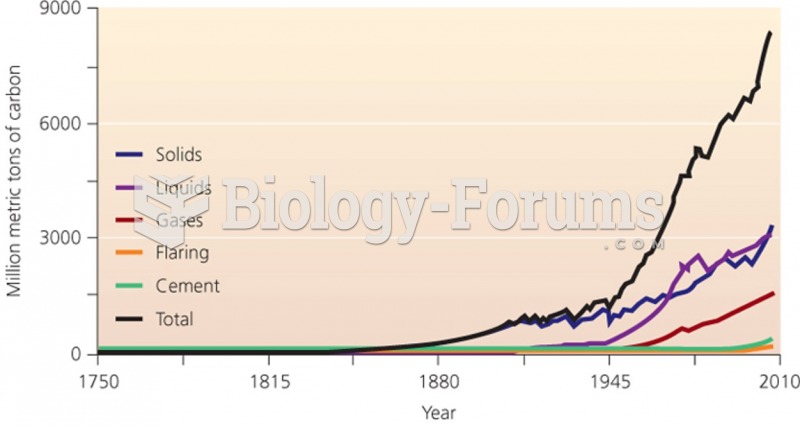 Fossil fuel emissions and climate change
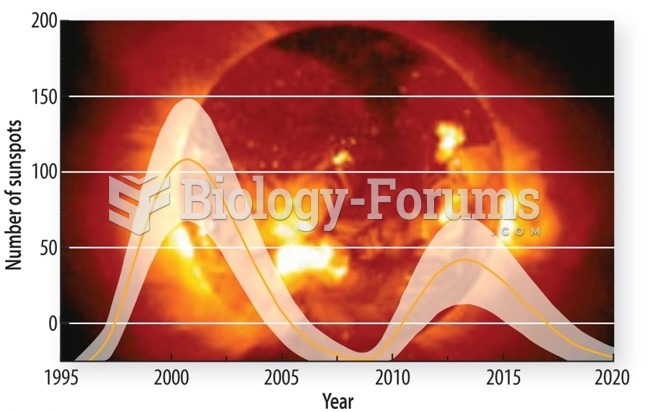 The Sun and climate change
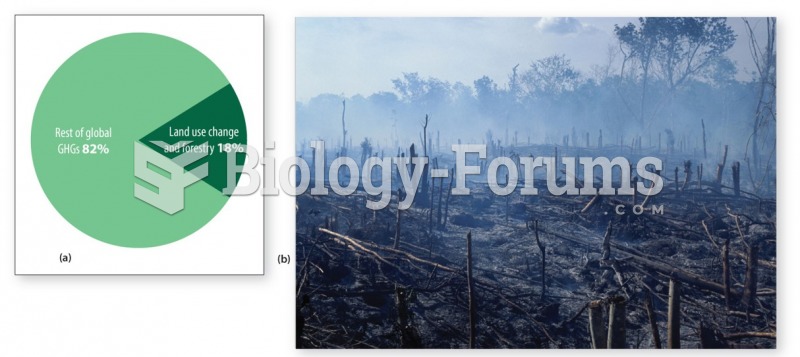 Land use change and forestry are responsible for 18% of global greenhouse gas emissions
 The Kinsey Report on American Women
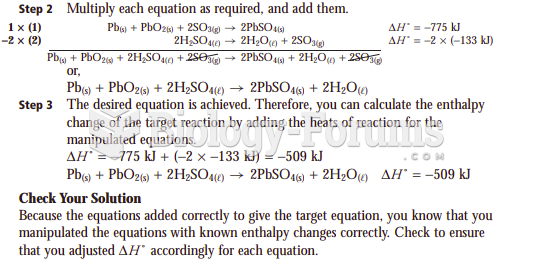 Determine the enthalpy change of this reaction