This topic contains a solution. Click here to go to the answer
|
|
|

 Examining the survivorship curve of a Dall mountain sheep population reveals information on the caus
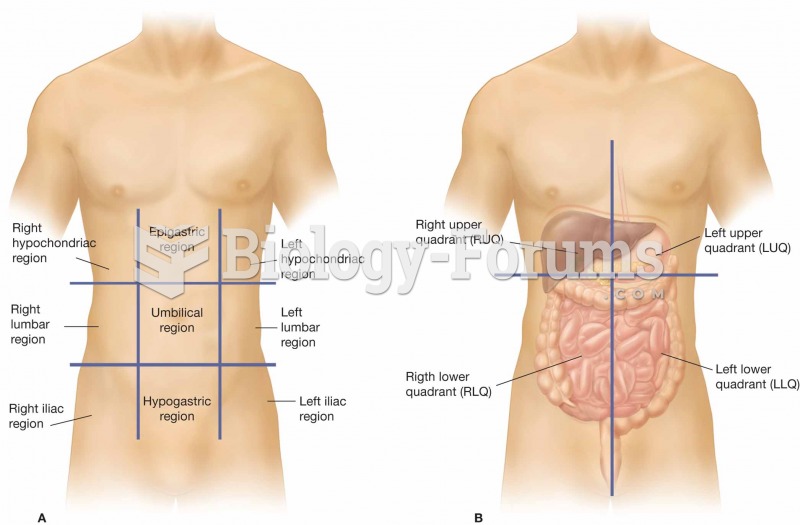 (A) The nine regions of the abdominopelvic cavity. (B) The four regions of the abdomen, which are re
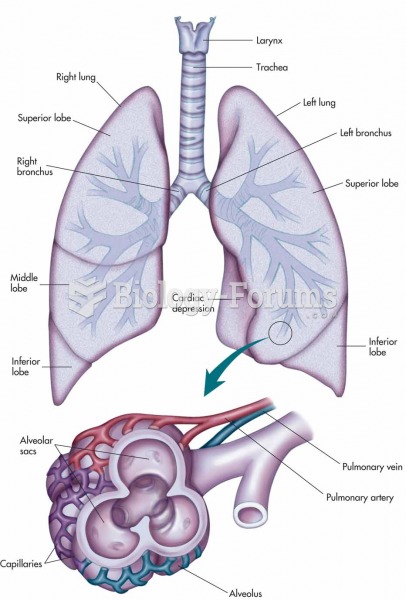 Larynx, trachea, bronchi, and lungs with an expanded view showing the structures of an alveolus and
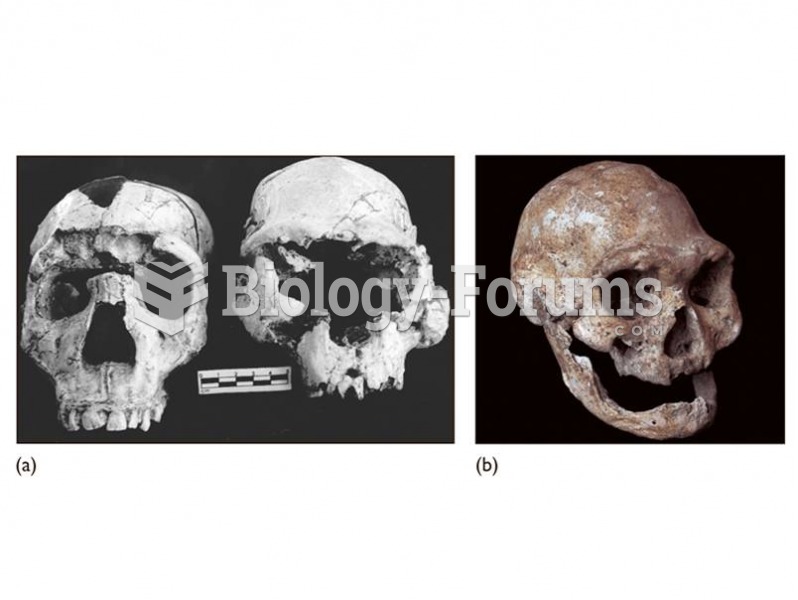 (a) The Dmanisi cranium (right) shows similarities to early African H. erectus including the Narioko
 Hockey stick” curve
 The slope of the curve y = ax^3 - bx^2 + cx - 3 at x = 2 is 5. If the point of inflection of the cur